As we begin February, the northern hemisphere winter has been unseasonably warm and less snowy for much of the United States and parts of Western Europe. Chicago, for example, had its warmest start to winter in about eighty years. While Punxsatawney Phil saw his shadow on Groundhog Day (2 February), indicating six more weeks of winter, NOAA’s Climate Prediction Center (CPC) suggests continued above normal temperatures for much of the U.S. over the next three months. For this EarthNow entry, we’ll take a look at snow and ice cover for January 2012 and how that compares with January 2011. Further, we’ll investigate how the North Atlantic Oscillation (NAO) may have a role in the not so winter-like conditions.
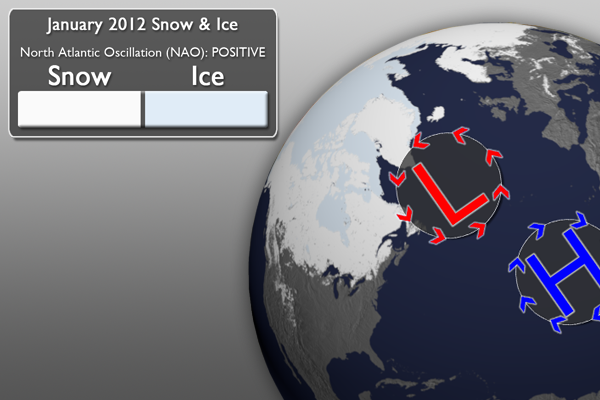
- This dataset shows the average snow and ice cover for January 2012.
- After 10 seconds, High and Low Pressure icons will display on the SOS dataset. They will be relatively large icons, representing unusually strong low pressure over the North Atlantic (near Greenland and Iceland) and unusually strong high pressure over an area of the Atlantic several thousand miles south.
- After another 10 seconds, a jet stream icon will display on the image. The unusually high and low pressure areas creates a very strong pressure gradient, which results in the jet stream to staying further north and zonal across the U.S. and Atlantic into Western Europe. Zonal simply means that the pattern is mostly straight across (from west to east) and isn’t very wavy.
- This is the pattern that sets up during a positive (+) phase of the North Atlantic Oscillation (NAO).
- Because the jet stream doesn’t dip very far south, the temperatures for the eastern part of the United States and western Europe tend to be above normal.
- Further, storm systems (like snow storms) thrive on more wavy jet stream patterns, and so, with fewer storm systems and warmer than normal temperatures, these parts of the world experience unusually warm and less snowy winters.
- The NAO has little impact on other parts of the world. Eastern Europe, for example has experienced a colder and snowier winter than normal.
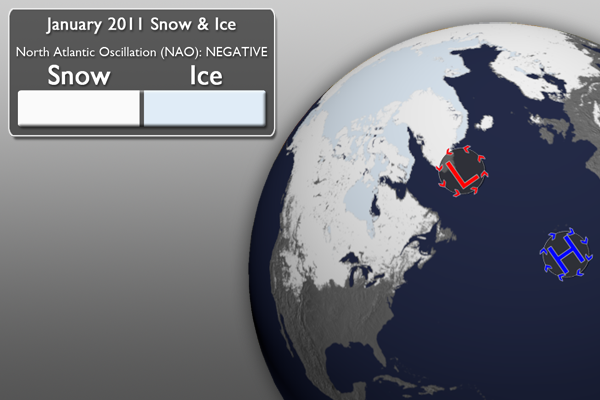
 January 2011, NAO: –
- This dataset shows the average snow and ice cover for January 2011. There is notably more snow across the U.S. and western Europe.
- After 10 seconds, High and Low Pressure icons will display on the SOS dataset. They will be relatively small icons, representing an unusually weak low pressure over the North Atlantic (near Greenland and Iceland) and an unusually weak high pressure over an area of the Atlantic several thousand miles south.
- After another 10 seconds, a jet stream icon will display on the image. The unusually weak high and low pressure areas means there isn’t much of a pressure gradient across the North Atlantic. This can occur when the jet stream is very wavy as it moves off the coast of the United States.
- This is the pattern that sets up during a negative (-) phase of the North Atlantic Oscillation (NAO).
- Because the jet stream dips farther to the south, the temperatures for the eastern part of the United States and western Europe tend to be below normal. Also, the more wavy jet stream patterns supports more slow-moving winter storms, resulting in more snowy conditions.
For a great explanation about the North Atlantic Oscillation by Penn State, click here!
NOAA also has a a nice explanation (albeit more technical) here.
The NAO is harder to predict than other more long-lasting cycles (like El Niño and La Niña), scientists use an array of models to help us predict what the NAO might do next. The latest models runs (at time of publication) suggest the NAO will remain in a positive phase (but perhaps drift closer to neutral).
That’s all for this week. The next post will be the January Climate Digest. Remember, to use the comments link below to discuss this topic with the EarthNow team, as well as the Science On a Sphere Network!
Where do I find the datasets?
- First, check your SOS system to make sure it’s not already in the EarthNow category. There should also be an ‘earthnow.sos’ playlist file (you’ll need to add that to your sosrc folder).
- If not, you can download the datasets and playlist.sos files from this FTP Site.


