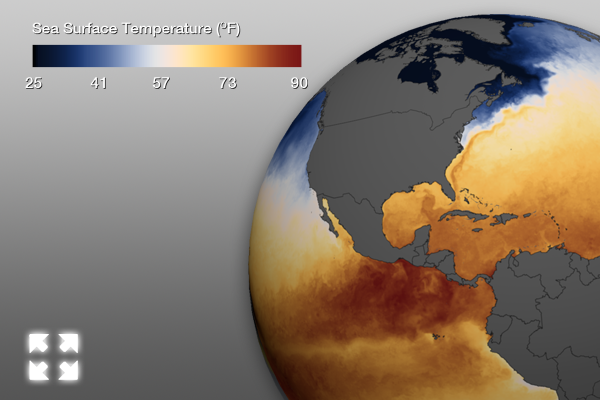
As Dan Pisut mentioned a little while ago, the real-time Sea Surface Temperature (SST) dataset for Science On a Sphere has been tweaked a bit, having a new color scale and higher definition, both providing for more detail. As a reminder, here is what Dan mentioned in his email to the SOS Network:
“NOAA recently developed a higher resolution daily product that we’re processing for the SOS. In fact, the imagery is downsized from its native 7200×3600 pixels (if you’d like the full imagery for other projects, just email me). Besides the higher resolution, we have modified the color scheme to better align with the best practices for content development, still be intuitive, and better enhance features like currents. The archive is being updated so that the color is consistent over time.”
Well, now that the new real-time SST visualization has some more detail, we thought it would be good to go into a little detail about what you are seeing via EarthNow.
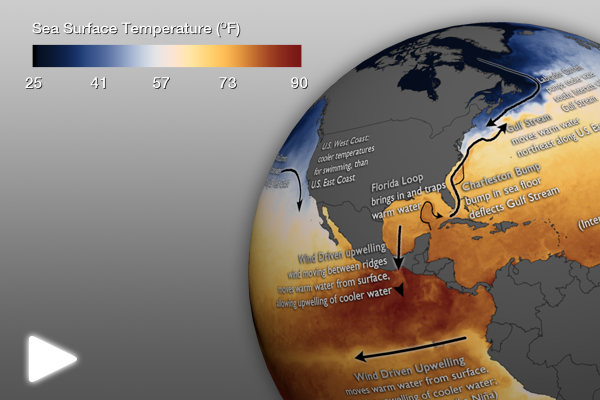
Labeled SST Map
To help with visualizing some of what’s to be described, we’ve created two annotated datasets. The first is one frame (one still image) from the new SST dataset. It’s labeled with various currents and other features. While movement of water could be seen on the older SST imagery, the new dataset more clearly illustrates the relationship between the ocean’s surface currents and temperature. To keep the blog text at a minimum, any of the information regarding each feature is displayed on the image itself. Click on the image above to open a Full-Earth image and see the details.
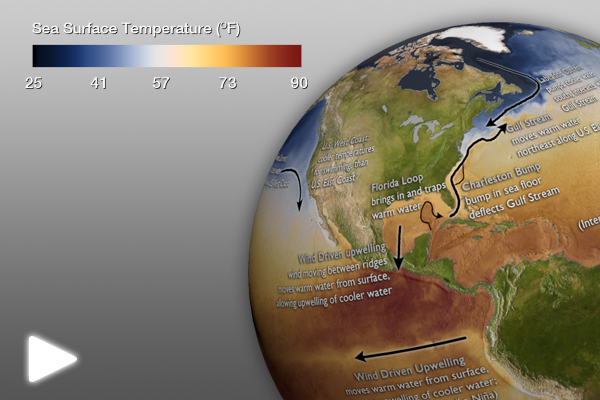
Labeled SST Map with Topography
Some of the currents and features labeled on the previous map are affected by the topography of the ocean floor (bathymetry) or topographical land features. This visualization is the same, but has a topographic map under the SST data. Again, by clicking on the image to the left, a Full-Earth image will open to better see the labels and map detail.
Presentation Ideas:
- Show real-time SST animation dataset (no labels) and ask audience to look for temperature patterns and movements.
- Then, show the labeled SST image and/or the labeled SST with topography image to further explain some of the temperature patterns and movements.
Where do I find the datasets?
- First, check your SOS system to make sure they are not already in the EarthNow category. There is also an earthnow.sos playlist file that includes a playlist with all of these datasets.
- If not, you can download the datasets and playlist files from this FTP Site.


