NOAA’s National Climatic Data Center and the American Meteorological Society recently released the 2011 State of the Climate Report, showcasing some of the major weather and climate highlights of the year and discussing the “hows” and “whys” of 2011’s climate story.
One of the primary influences on the 2011 climate story was La Niña – the cool phase of the El Niño-Southern Oscillation (ENSO). In fact, the central and eastern tropical Pacific was cooler than normal both at the beginning of the year and the end of the year, hence why it’s being referred to as the “double-dip La Niña.”
According the NOAA’s National Climatic Data Center (NCDC), “these natural cooling events have a long reach: many of the big climate events of 2011, including famine-inducing drought in East Africa, an above-average hurricane season in the Atlantic, and record rainfall in many parts of Australia, are common ‘side effects’ of La Niña.” With this EarthNow post, we’ll take a closer look at some of global effects of La Niña.

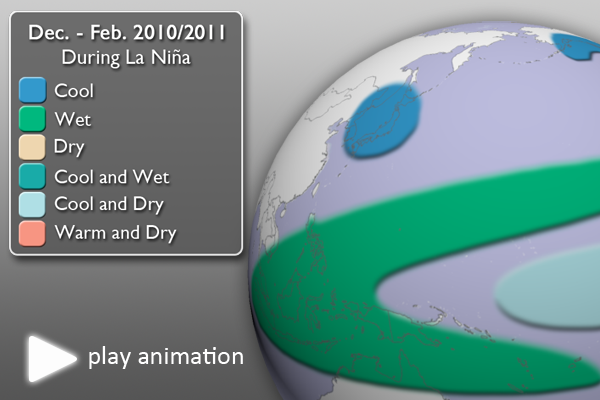
La Niña Effects • Animation not work? Try here • Still Map Image
With La Niña
- 2011 started off under La Niña conditions, running from December 2010 through about May.
- This first visualization, adapted from NOAA’s Climate Prediction Center and ClimateWatch Magazine, shows the global effects of La Niña.
- The graphic is specifically for December 2010 – February 2012 (the peak of the 2011 La Niña).
- Notice how much of the tropical moisture is trapped in the western tropical Pacific Ocean, as the easterly trade winds winds (those coming from the east) are stronger during a La Niña. As a result, the eastern tropical Pacific is drier than normal.

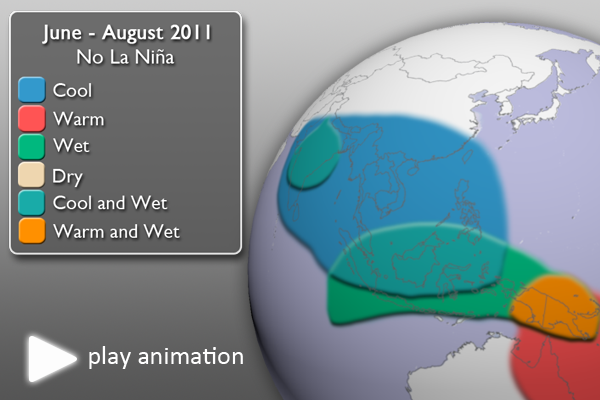
No La Niña Effects • Animation not work? Try here. • Still Map Image
Without La Niña
- As the northern hemisphere headed into summer, La Niña lost its grasp. The central and eastern tropical Pacific waters warmed to near normal conditions, meaning that ENSO was now in a “neutral” phase.
- This visualization shows what “neutral” ENSO conditions meant for the global weather and climate patterns from June through August 2011.
- Some of the drought regions in southern North America and eastern Africa received some relief, and the heavy rains in Southern Africa waned.
That’s all for now. Next week, we’ll take a closer look at the recent droughts.
Where do I find the datasets?
- First, check your SOS system to make sure they are not already in the EarthNow category. There is also an earthnow.sos playlist file that includes a playlist with all of these datasets.
- If not, you can download the datasets and playlist files from this FTP Site.
Helpful Resources for More Information
- http://www.ncdc.noaa.gov/oa/ncdc.html National Climatic Data Center (NCDC)
- http://www.ncdc.noaa.gov/teleconnections/enso/enso-tech.php About ENSO (El Niño/La Niña)
- http://www.ncdc.noaa.gov/bams-state-of-the-climate/2011.php 2011 State of the Climate Report
- http://www.climatewatch.noaa.gov/article/2012/state-of-the-climate-in-2011-highlights/4 NOAA ClimateWatch Magazine


