
March 2013 Climate Digest • iPad Video
SOS Playlists
 SOS Playlist
 SOS AutoRun/Audio Playlist
Overview
Each month, we will provide information regarding the previous month’s climate. Overall, preliminary data analysis suggests that March 2013 was the 10th warmest on record (since 1880), tied with 2006. Major stories include a chilly United States, warmer than normal Australia, and the continued absence of El Niño or La Niña.
March 2013 Highlights • iPad Video
Highlights Dataset
Dataset: 20130422 EarthNow: March 2013 Highlights
Dataset: 20130422 EarthNow: AUDIO March 2013 Highlights
 Full Map Image
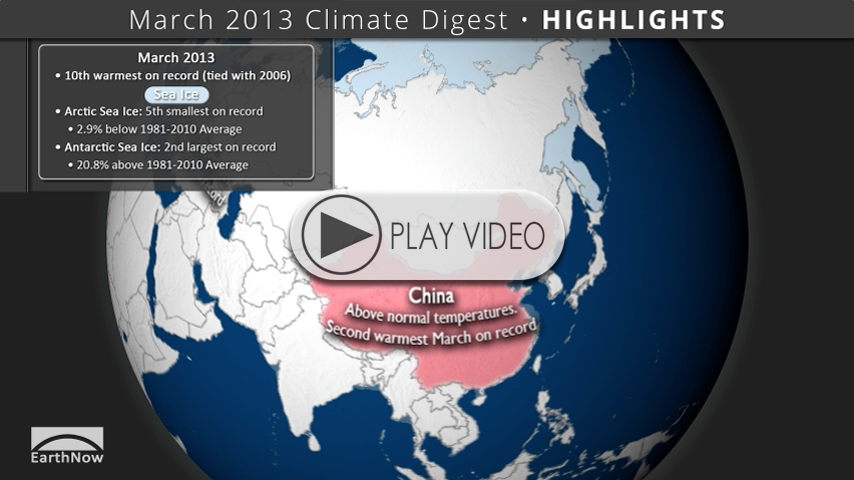
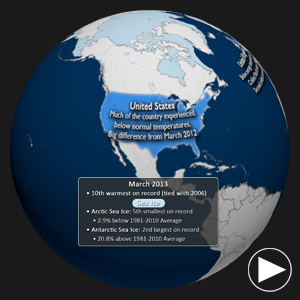
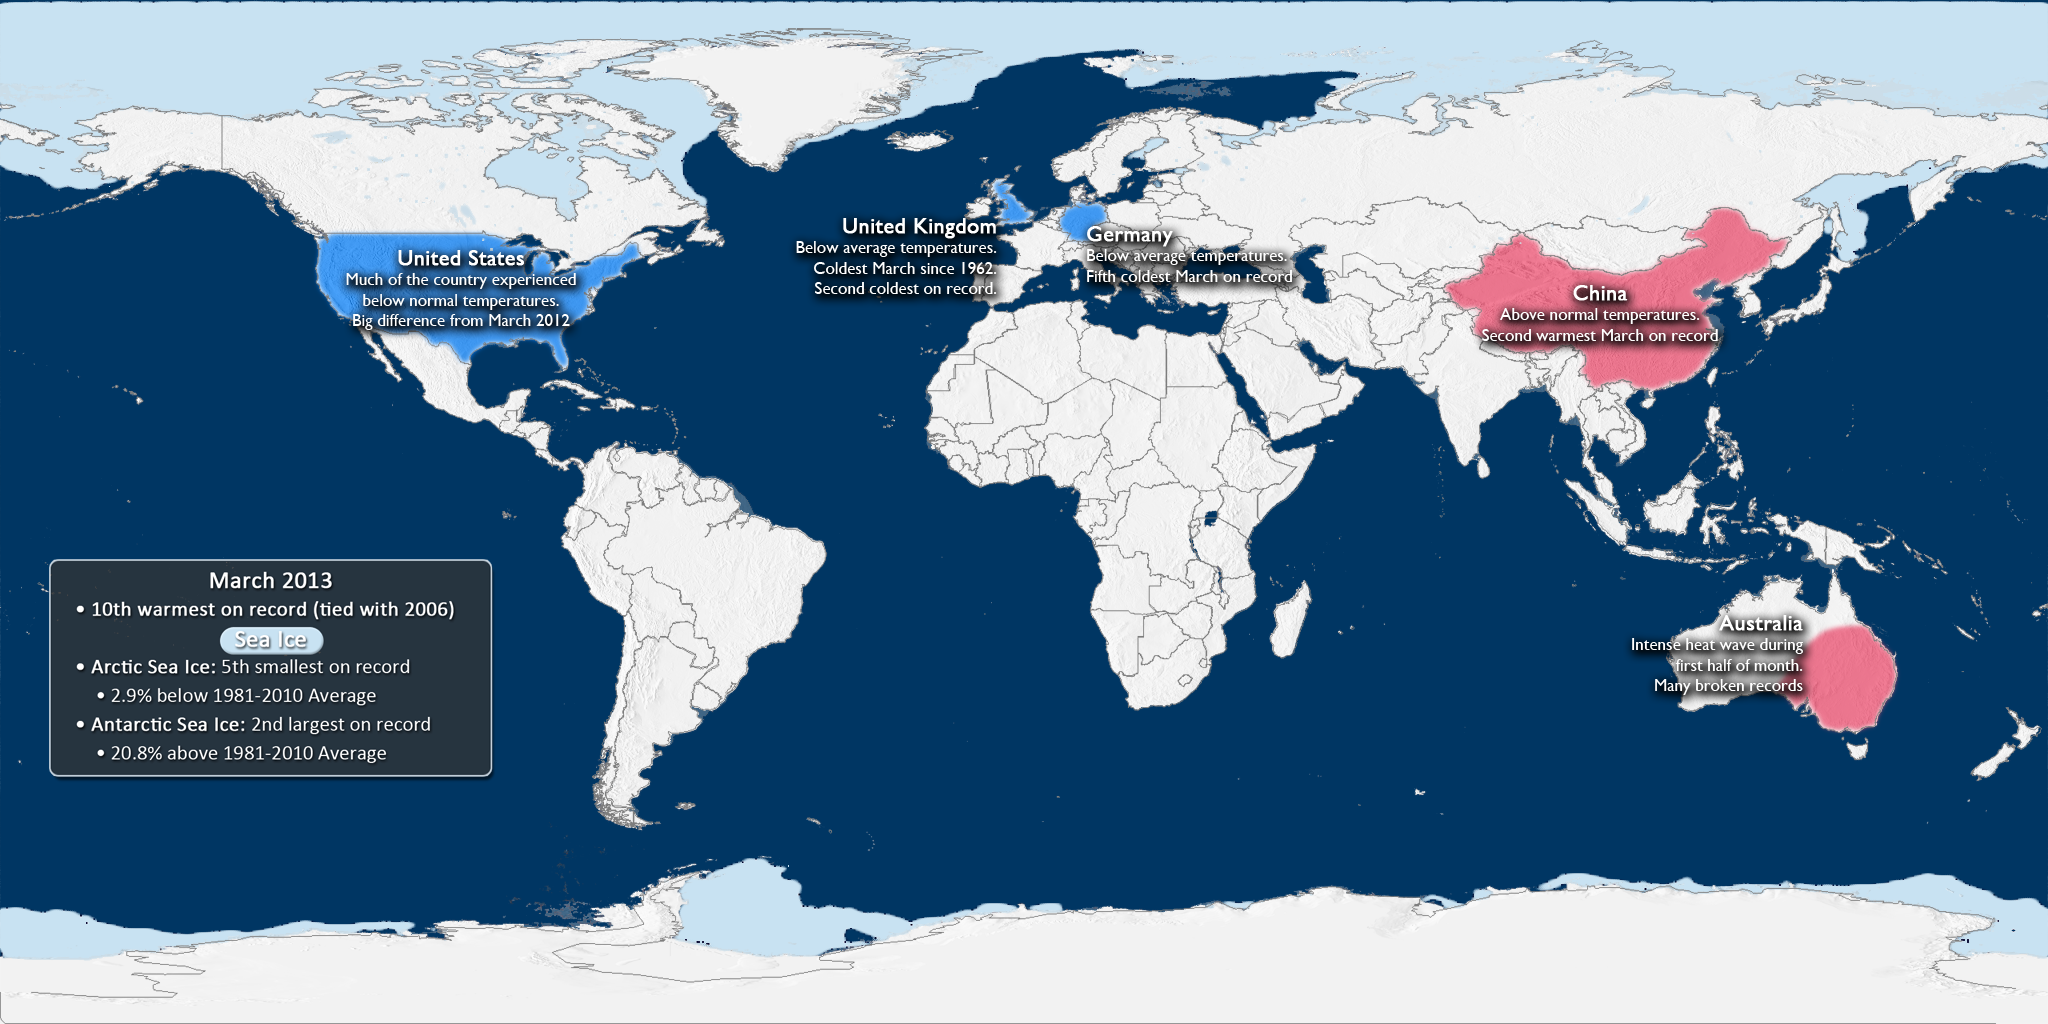
- This dataset shows some of the major March weather and climate highlights from the National Climatic Data Center’s (NCDC) monthly global climate analysis, and serves as an overview of what can be discussed in the datasets that follow. Highlights are noted below with more information.
- United States: Much of the U.S. was colder than normal, experiencing the coolest March since 2002. This is a stark contrast to 2012’s warmer than normal March.
- Australia: Southeastern Australia experienced a strong heatwave during the first half of March, breaking numerous records.
- China: China experienced its second warmest March on record.
- Germany: Germany was colder than normal, experiencing its fifth coldest March on record.
- United Kingdom: The U.K. was also colder than normal, experiencing its coldest March since 1962, and second coldest on record.
- Arctic Sea Ice Extent: Fifth smallest on record, at 2.9% below the 1981-2010 average.
- Antarctic Sea Ice Extent: Second largest on record, at 20.8% above the 1981-2010 average.
March 2013 Temperature Differences • iPad Video
Global Temperature Anomalies Dataset
Dataset: 20130422 EarthNow: March 2013 Temperature Anomaly
Dataset: 20130422 EarthNow: AUDIO March 2013 Temperature Anomaly
Full Map Image
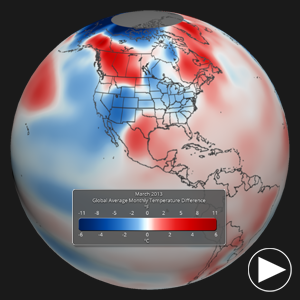
- Using the real-time Monthly Temperature Anomalies dataset is a great way to convey where some of the warmer and cooler than average areas were in March, including those mentioned above in the highlights.
- The combined global land and ocean average surface temperature for March was the 10th warmest on record (since 1880), tied with 2006.
March 2012 vs. March 2013 • iPad Video
March 2012 – March 2013 Comparison
Dataset: 20130422 EarthNow: March 2012/2013, Temperature Comparison
Dataset: 20130422 EarthNow: AUDIO March 2012/2013, Temperature Comparison
- This dataset visualization uses the same data as the monthly global temperature anomalies, but periodically switches back and forth between March 2012 and March 2013, highlighting the stark difference between the two years, especially in the United States.
March 2013 SST Anomalies • iPad Video
Sea Surface Temperature Anomalies Dataset
Dataset: 20130422 EarthNow: March 2013 SST Anomaly
Dataset: 20130422 EarthNow: AUDIO March 2013 SST Anomaly
Full Map Image
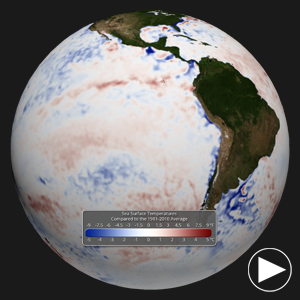
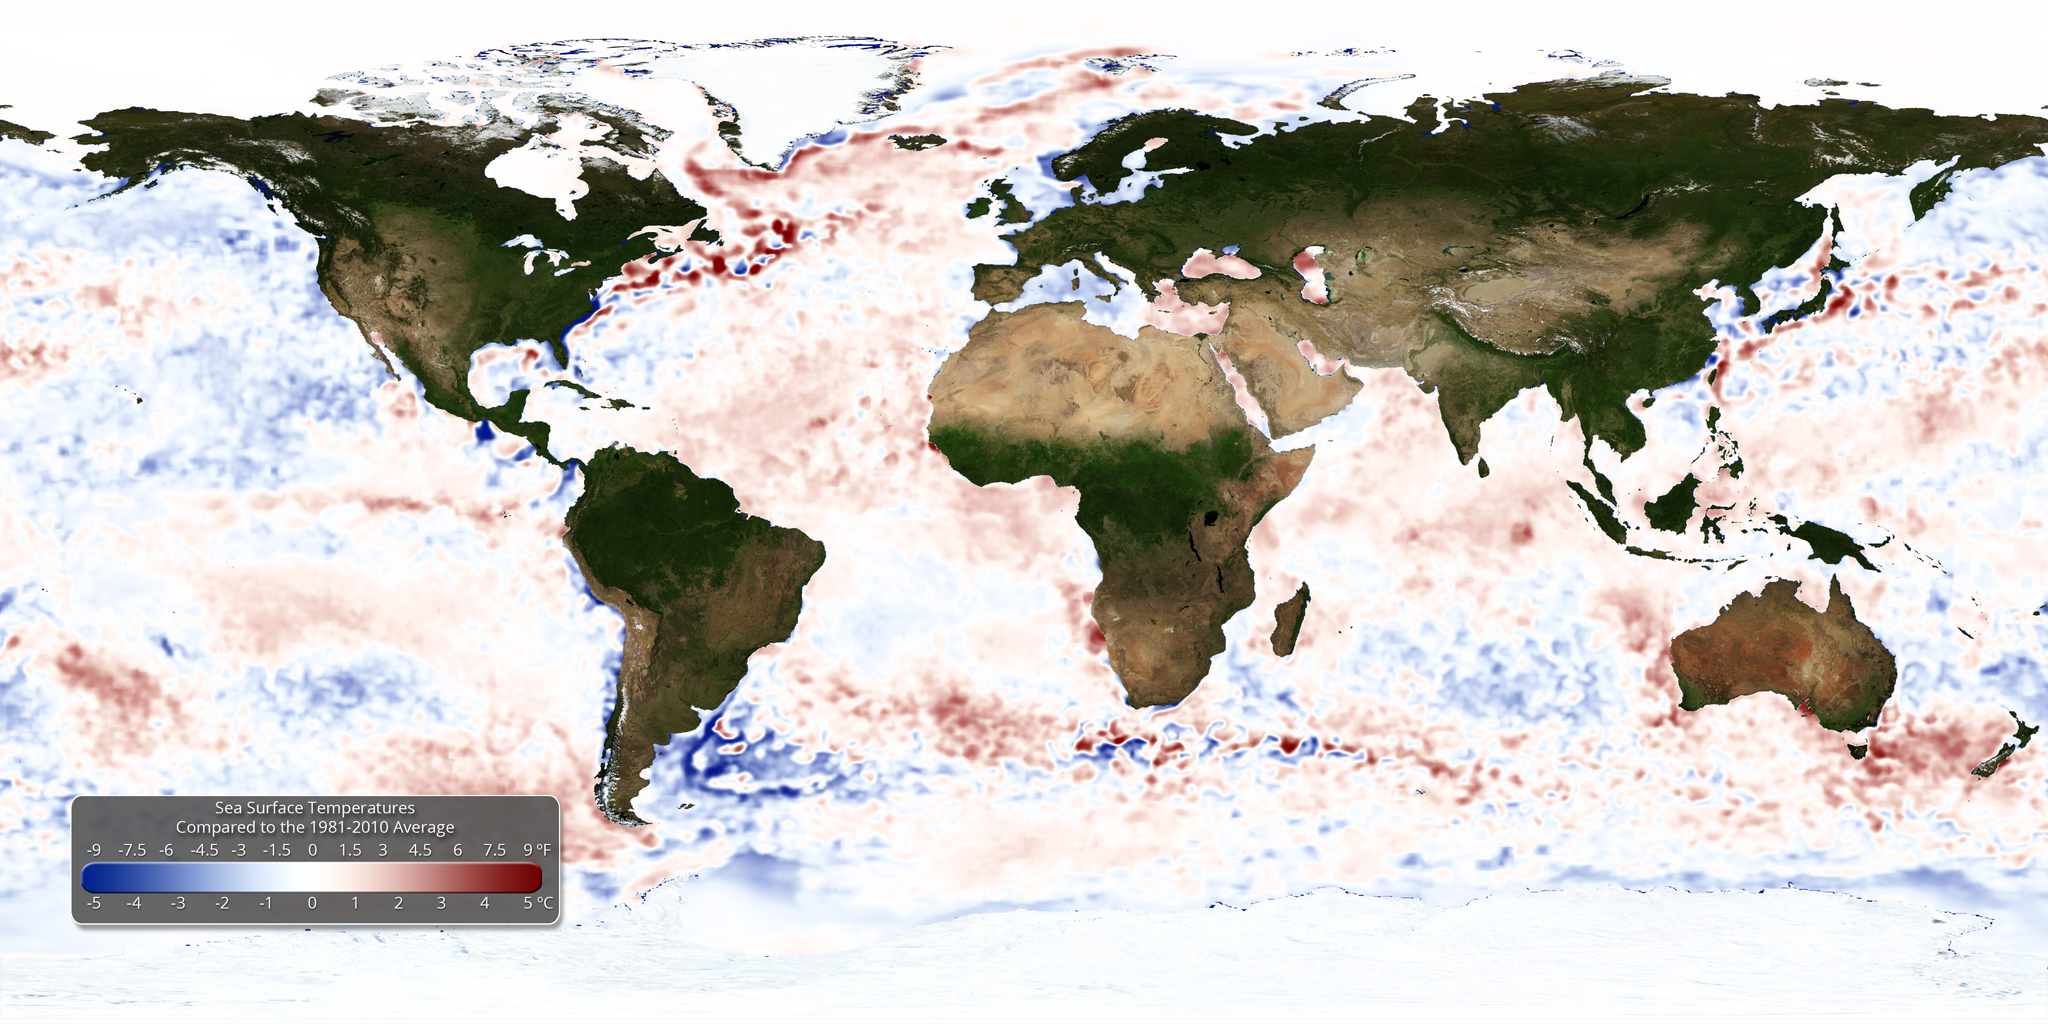
- The real-time sea surface temperature anomaly dataset is a great way to visualize the El Niño – Southern Oscillation (ENSO) cycle in the eastern tropical Pacific ocean. For March 2013, these waters were just slightly above average, indicating an ENSO Neutral period.
- Remember that the blues indicate cooler than average temperatures and reds indicate warmer than average temperatures (white: average).
- The Climate Prediction Center expects the neutral conditions to prevail through at least the Northern Hemisphere Summer.
March 2013 Snow and Ice • iPad Video
Snow and Ice Cover Dataset
Dataset: 20130422 EarthNow: March 2013 Snow and Ice Cover
Dataset: 20130422 EarthNow: AUDIO March 2013 Snow and Ice Cover
Full Map Image
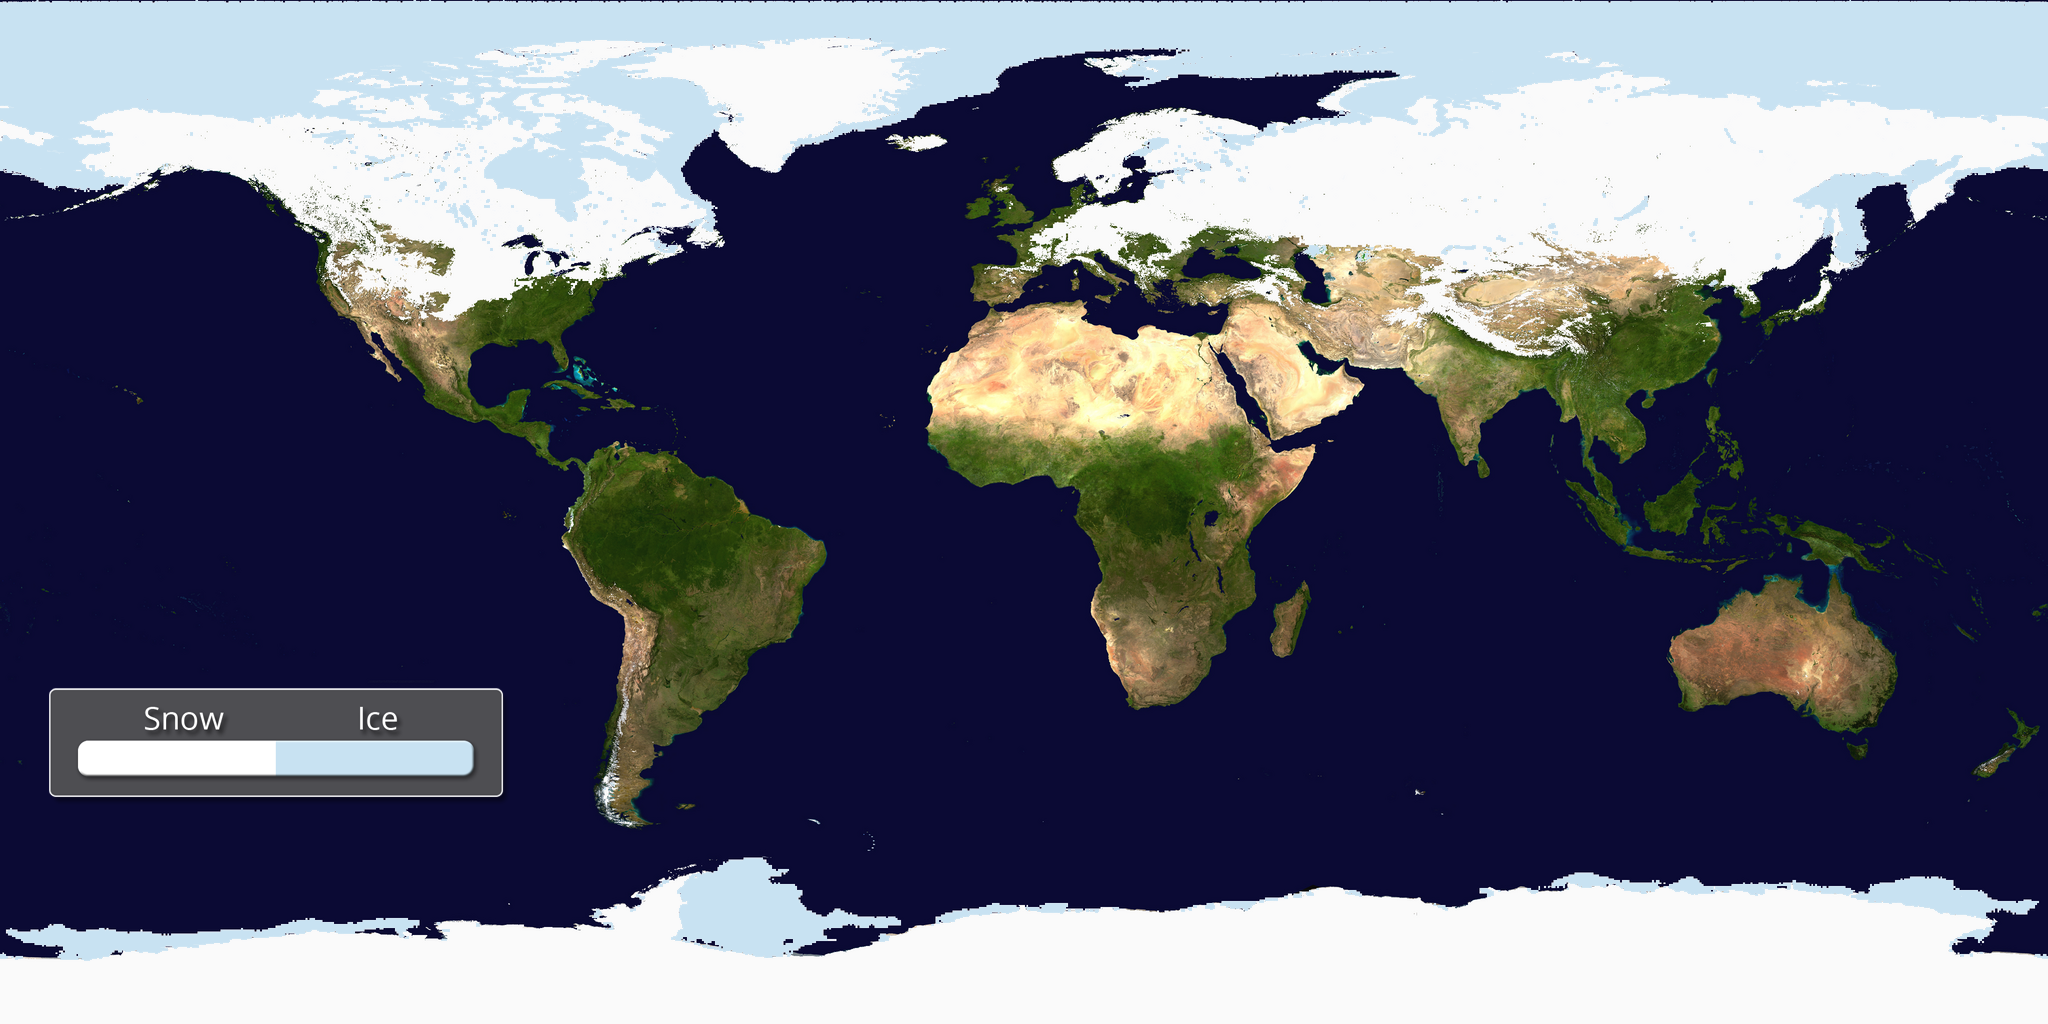
- Aside from helping to illustrate seasonal changes, the real-time Snow and Ice Cover dataset is a great way to convey sea ice change through time, including discussing how the current sea ice extent compares to other noteworthy years.
- The Arctic sea ice extent in March was the fifth smallest on record. The extent was 2.9% below the 1981-2010 average.
- In Antarctica, the sea ice extent was the second largest on record, at 20.8% above the 1981-2010 average.
- The North American snow cover extent was the 6th largest on record (since 1967).
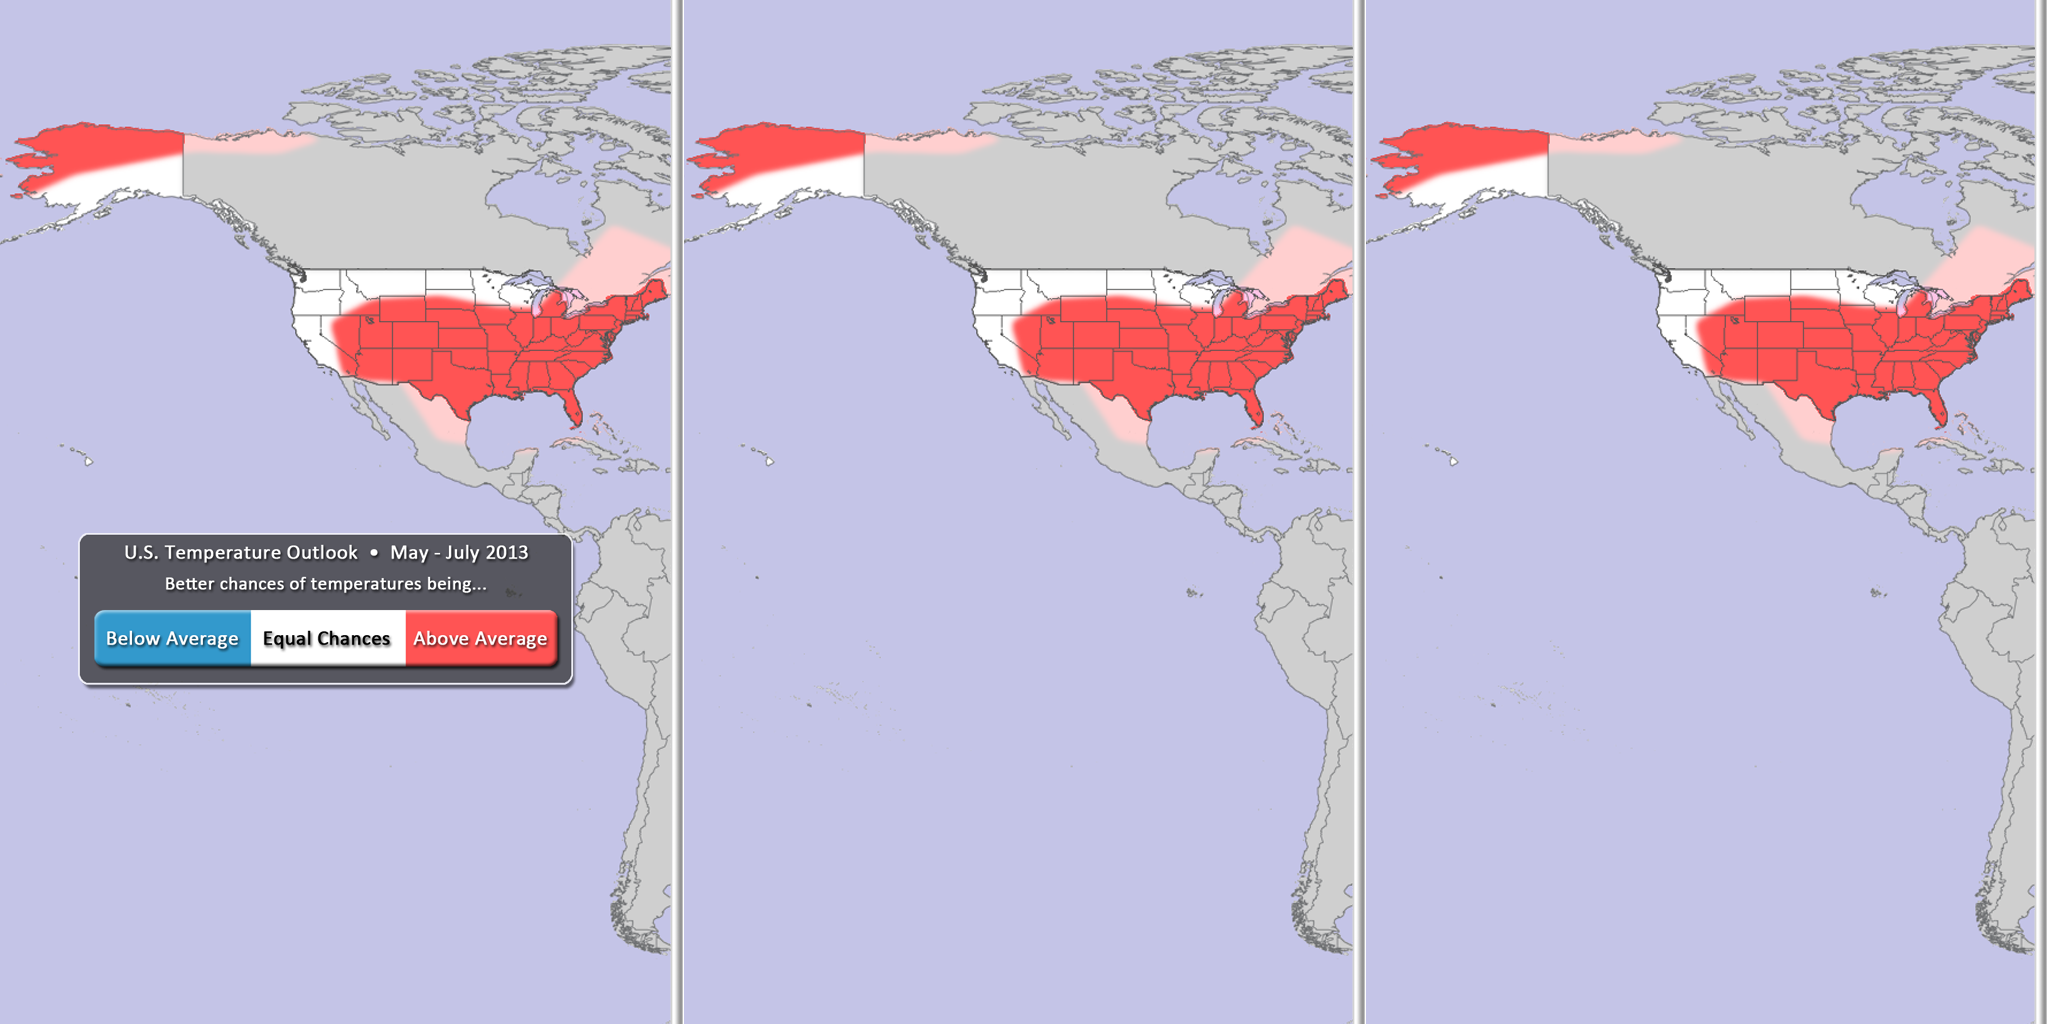
U.S. Temperature Outlook
Dataset Name: 20130422 EarthNow: U.S. Temperature Outlook (May-July 2013)
Still Map Image
- Sea Surface Temperatures in the ENSO (El Niño Southern Oscillation) region suggest continued neutral conditions, according to NOAA’s Climate Prediction Center.
- For the May – July period, warmer than normal temperatures are expected for much of the eastern and southern portion of the U.S., as well as northern Alaska.. (Red)
- All other locations have equal chances of being warmer or cooler than normal. (White)
- Outlook by NOAA’s Climate Prediction Center (CPC)
- In its forecasts, the CPC uses a wide variety of models in conjunction with looking at climate variables (like El Niño).
- It should be noted that areas in the “warmer than normal” region may still have cooler than normal days. This outlook only suggests that after the three months are over, those areas in the “warmer than normal” region are more likely to have experienced warmer than normal average temperatures.
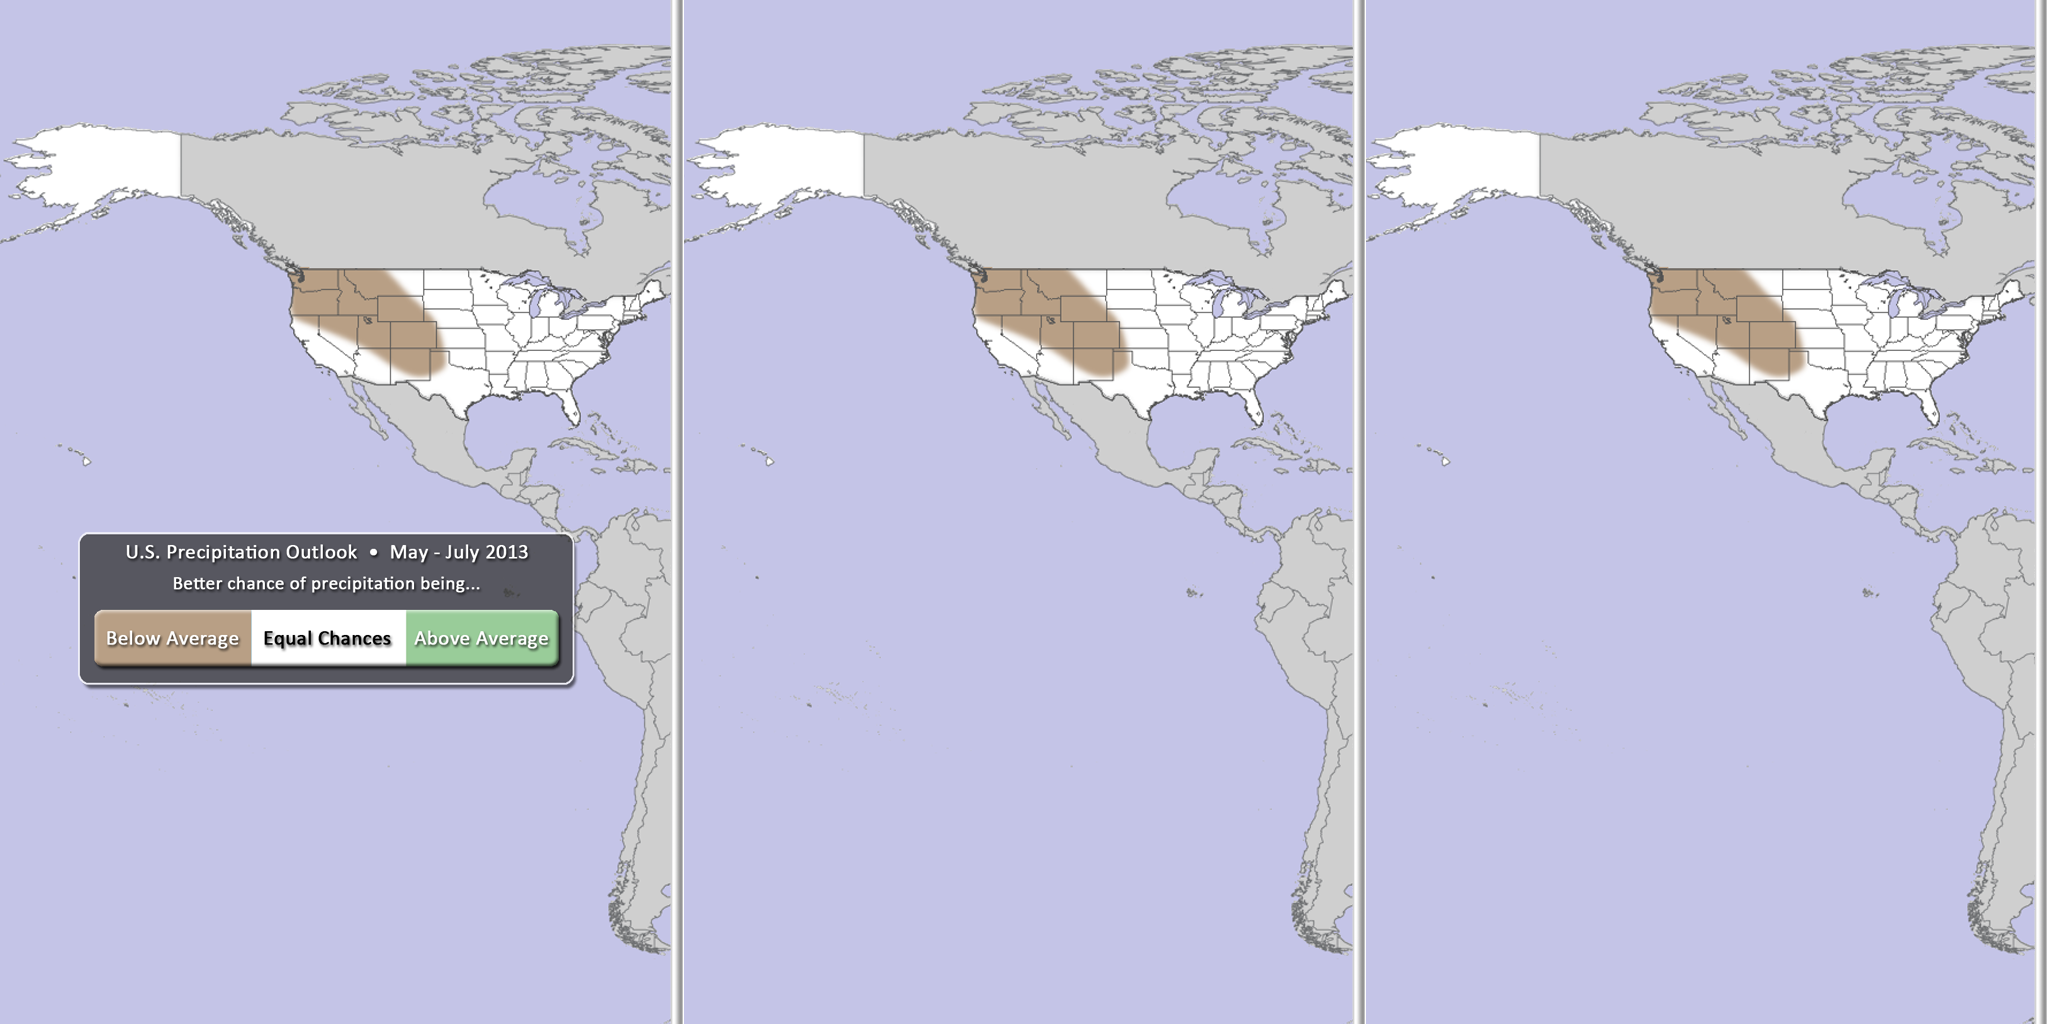
U.S. Precipitation Outlook
Dataset Name: 20130422 EarthNow: U.S. Precipitation Outlook (May-July 2013)
Still Map Image
- For the next three months (May – July), drier than normal conditions are expected for a good portion of the western part of the country, including especially the Pacific Northwest. (Brown)
- All other locations have equal chances of being wetter or drier than normal. (White)
- Outlook by NOAA’s Climate Prediction Center (CPC)
- In its forecasts, the CPC uses a wide variety of models in conjunction with looking at climate variables (like El Niño).
- It should be noted that areas be in the “drier than normal” region may still have rainy or snowy days. This outlook only suggests that after the three months are over, those areas in the “drier than normal” region are more likely to have experienced drier than normal averages.
U.S. Drought Outlook
Dataset Name: 20130422 EarthNow: U.S. Drought Outlook (May-July 2013)
Still Map Image
- This dataset shows the NOAA Climate Prediction Center (CPC) U.S. drought outlook for May – July 2013.
- Much of the western portion of the U.S. is expected to have drought conditions persist or even intensify.
- As we move eastward, however, the Great Plains are expected to have at least some recovery. This is also true for some parts of the southeast.
Where do I find the datasets?
-
First, check your SOS system to make sure it’s not already in the EarthNow category.
-
If not, you can download the datasets and playlist files from this FTP Site.
-
Then download and use playlist files at the top of the page (or create your own) and make sure they are in /home/sos/sosrc or /home/sosdemo/sosrc.
-
More detailed information here
Helpful Resources for More Information
-
http://www.ncdc.noaa.gov/oa/ncdc.html National Climatic Data Center (NCDC)
-
http://www.ncdc.noaa.gov/teleconnections/enso/enso-tech.php About ENSO (El Niño/La Niña)
-
http://www.ncdc.noaa.gov/sotc/global/ NCDC’s Global Climate Report


