Autumn 2018 Climate Digest

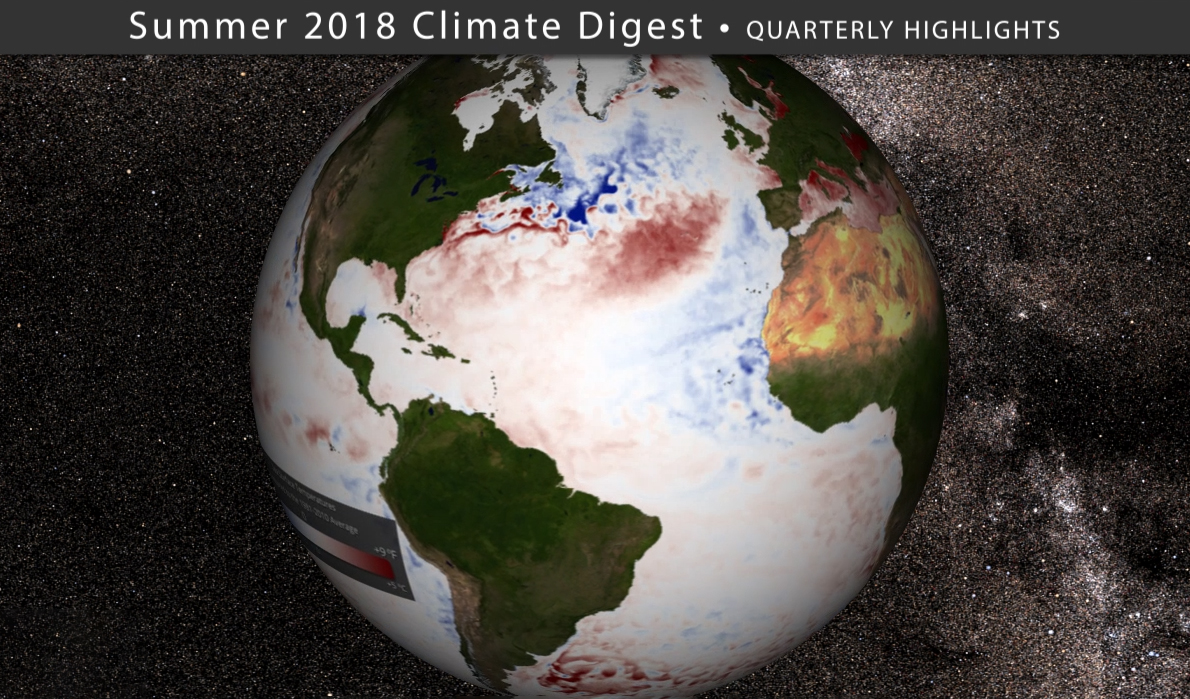
Averaged as a whole, the global land and ocean surface temperature for September–November 2018 was 1.44°F (0.80°C) above the 20th century average—the second warmest in our 139-year record.

The global ocean-only surface temperature was also the second highest for September–November.

In the United States, the average temperature for the Lower 48 was very near normal. However, the autumn precipitation total for the contiguous U.S. was 9.61 inches, which is 2.73 inch above the long-term average. This placed us at the second wettest autumn on record, in large part due to heavy rains associated with Hurricanes Florence and Michael.

Hurricane Florence was a long-lived tropical cyclone that brought devastating flooding to the Carolinas in September. Florence moved extremely slowly after making landfall near Wrightsville Beach, North Carolina on September 14th, which caused a prolonged storm surge event along the coast and extremely high rainfall totals. Numerous locations observed over 30 inches of precipitation from the storm causing rivers to crest at all-time high levels. The highest rainfall was measured near Elizabethtown, NC with a total of 35.93 inches. Adding to the havoc, 34 tornadoes were spawned as Florence moved inland. There were at least 51 fatalities blamed on the storm and damages are expected to easily exceed $1 billion.

Hurricane Michael was a major October hurricane that approached the U.S. from the Gulf of Mexico and made landfall on the Florida panhandle on October 10th.  According to pressure measurements, Michael was the third most intense hurricane to make landfall in the United States and fourth most intense based on wind speed. There were at least 60 fatalities blamed on Hurricane Michael and damages are also expected to be well over $1 billion.

The Atlantic hurricane season officially concluded on November 30th.

The quarterly climate digest, produced seasonally, consists of a short movie (5:07 minutes) made for Science On a Sphere® (SOS) and an MP4 video accessible through YouTube.

You can download the SOS content from this FTP Site.

Content includes:
– Global 3-month averaged temperatures
– 3-month Sea Surface Temperature (SST) anomalies
– 6-day animation of Hurricane Florence, including landfall
– GOES-16 30-second imagery of Hurricane Michael landfall

References:

https://www.ncdc.noaa.gov/sotc/tropical-cyclones/201809
https://www.ncdc.noaa.gov/sotc/tropical-cyclones/201810
https://www.ncdc.noaa.gov/sotc/global/201809
https://www.ncdc.noaa.gov/sotc/national/201810
https://www.ncdc.noaa.gov/sotc/national/201811
https://www.ncdc.noaa.gov/sotc/global/201811


Credits:
EarthNow Team
National Oceanic and Atmospheric Administration(NOAA)

Monthly state of the climate reports are available from NOAA National Centers for Environmental Information (NCEI) Climate Global Analysis and National Overview at https://www.ncdc.noaa.gov/sotc/


Category: Climate Digest

Comments Off on Autumn 2018 Climate Digest
comments 
Comments Off on Autumn 2018 Climate Digest

Summer 2018 Climate Digest

The global land and ocean surface temperature for June-August 2018 was 1.33° Fahrenheit (0.74 °C ) above average and the fifth warmest summer on records.

Looking at land temperatures only, 2018 was the fifth highest June-August on record.

Looking at sea surface temperatures, our global oceans also experienced the fifth warmest summer on record.

Of note – the last five years (2014–2018) comprise the five warmest June-August on record. 2016 was the warmest summer so far, boosted by a strong El Niño.

In the United States, the average temperature for the Lower 48 was 73.5°F, or about 2° above average, tying with 1934 as the fourth warmest summer on record. The summer precipitation total for the contiguous U.S. was nearly 9 inches, over half of an inch above average, ranking summer 2018 us as the 25th wettest summer on record.

The nationally averaged overnight low temperatures were record warm this summer, 2.5 degrees above average – beating out 2016 for the warmest summer nights on record.

In general, the U.S. summer overnight low temperatures are warming at a rate nearly twice as fast as afternoon high temperatures. The 10 warmest summer minimum temperatures have all occurred since 2002.

Hot and dry weather in the Southwest contributed to another devastating wildfire season this past summer, especially in California. The Mendocino Complex fire north of San Francisco became the largest on record at 422,000 acres, or 660 square miles, or roughly half the size of the state of Rhode Island. Five of the seven largest fires on record in California have occurred since 2012. But California wasn’t the only state battling wildfires –  several neighboring states and Canada also experienced large and prolonged wildfires.

The quarterly climate digest, produced seasonally, consists of a short movie (4:17 minutes) made for Science On a Sphere® (SOS) and an MP4 video accessible through YouTube.

You can download the SOS content from this FTP Site.

Content includes:
– Global 3-month land temperatures
– 3-month Sea Surface Temperature (SST) anomalies
– Global Wildfires for June, July and August 2018 (from NOAAView)
– Select MODIS and GOES-16 imagery of U.S. Wildfires

References:
https://www.ncdc.noaa.gov/sotc/global/201808
https://www.ncdc.noaa.gov/sotc/national/201808
http://wxguys.ssec.wisc.edu/2018/09/10/summer2018/

Credits:
EarthNow Team
National Oceanic and Atmospheric Administration(NOAA)

Monthly state of the climate reports are available from NOAA National Centers for Environmental Information (NCEI) Climate Global Analysis and National Overview at https://www.ncdc.noaa.gov/sotc/


Category: Uncategorized

Comments Off on Summer 2018 Climate Digest
comments 
Comments Off on Summer 2018 Climate Digest

Spring 2018 Climate Digest

The global land and ocean surface temperature for March–May 2018 was 1.48° Fahrenheit (0.82 °C ) above the 20th century average of 56.7°F and the fourth warmest spring in 139 years of records.

Looking at land temperatures only, 2018 was the fifth highest March–May on record.

Looking at sea surface temperatures, our global oceans experienced the fourth warmest spring on record.

Of note – May 2018 marks the 401st consecutive month with global temperatures above the 20th century average.

In the United States, March 2018 had near normal temperatures, April was much colder than normal, and May was the warmest May since records began. The 3-month period ranked the 22nd warmest spring on record.

Record and near-record precipitation was observed across the Southeast and Mid-Atlantic United States during spring 2018, largely due to slow-moving weather systems, including Subtropical Storm Alberto.

Alberto was unusual because it maintained strength over land, traveling as far north as the Great Lakes Region! Alberto reached Lake Huron as a remarkably well-defined system. In fact, Alberto is the first known tropical depression to travel so far north before June 1st, which is the official start date of Atlantic Hurricane Season.

The quarterly climate digest, produced seasonally, consists of a short movie (4:36 minutes) made for Science On a Sphere® (SOS) and an MP4 video accessible through YouTube.

You can download the SOS content from this FTP Site.

Content includes:
– Global 3-month land temperatures
– 3-month Sea Surface Temperature (SST) anomalies
– GOES-East (GOES-16) multi-day animation of Subtropical Storm Alberto
– Graphic depicting new NOAA study results on Hurricane slow-down

References:
https://www.ncdc.noaa.gov/sotc/global/201805
https://www.ncdc.noaa.gov/sotc/national/201805
https://www.ncei.noaa.gov/news/tropical-cyclone-slowdown

Credits:
EarthNow Team
National Oceanic and Atmospheric Administration(NOAA)

Monthly state of the climate reports are available from NOAA National Centers for Environmental Information (NCEI) Climate Global Analysis and National Overview at https://www.ncdc.noaa.gov/sotc/


Category: Uncategorized

Comments Off on Spring 2018 Climate Digest
comments 
Comments Off on Spring 2018 Climate Digest