Overview
Each month, we will provide information regarding the previous month’s climate. July 2015 was the warmest July on record, with the combined average global land and ocean temperature at 1.46° Fahrenheit, or 0.81°Celsius, above the 20th century average.
Highlights Dataset
Dataset: 20150821 EarthNow: July 2015 Highlights
Dataset: 20150821 EarthNow: AUDIO July 2015 Highlights
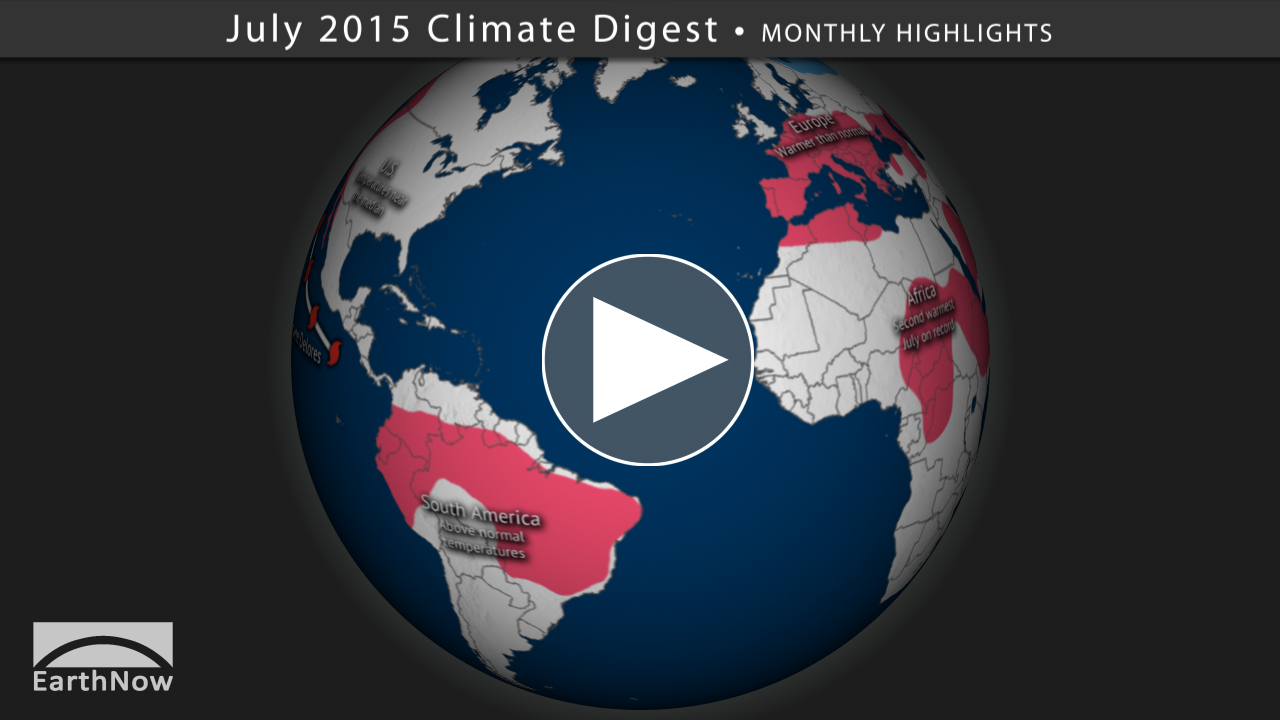
This dataset shows some of the major July weather and climate highlights from the National Climatic Data Center’s (NCDC) monthly global climate analysis, and serves as an overview of what can be discussed in the datasets that follow. Highlights are noted below.
- Typhoon Nangka: Warm waters of the West Pacific Ocean contributed to the formation of Nangka on July 3rd, which later made landfall in Japan, causing flooding rains and two fatalities.
- Australia: A significant cold outbreak occurred during the middle of the July resulting in widespread snowfall over parts of New South Wales and Queensland.
- Europe: Two extreme heat waves dominated the weather across Europe.
- Africa: The average temperature for Africa was the second highest for July on record, behind only 2002, with regional record warmth across much of eastern Africa.
- South America: For the Continent, July 2015 was the 5th warmest July ever recorded.
- United States: The average U.S. temperature for July was 73.9 degrees Fahrenheit, or two-tenths above the 20th century average, resulting in the month ranking near the median. Meanwhile, drought conditions worsened across the Pacific Northwest and in parts of the Southeast.
- Hurricane Dolores: Brought heavy rains to southern California, Nevada, and New Mexico.
Sea Surface Temperature Anomalies Dataset
Dataset: 20150821 EarthNow: July 2015 SST Anomaly
Dataset: 20150821 EarthNow: AUDIO July 2015 SST Anomaly
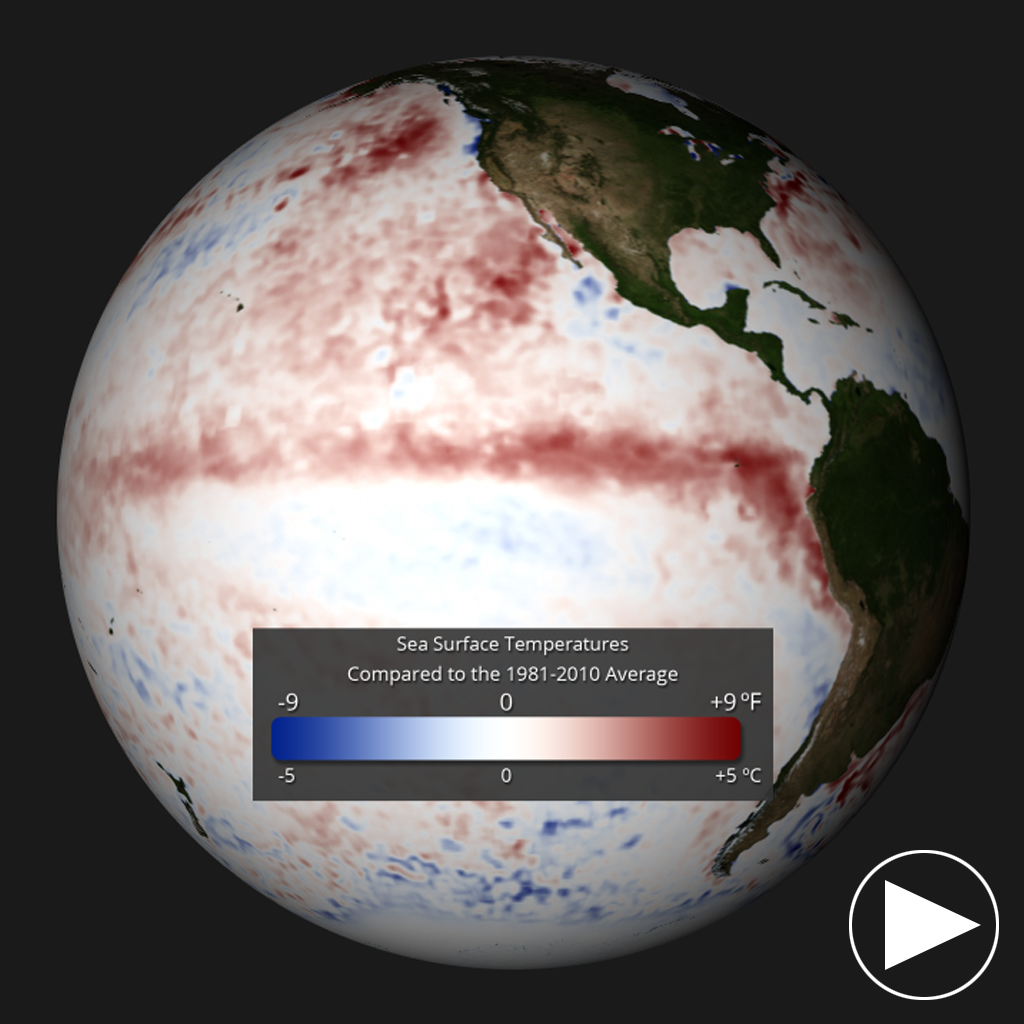
- The real-time sea surface temperature anomaly dataset is a great way to visualize the El Niño – Southern Oscillation (ENSO) in the eastern Pacific Ocean.
- The global sea surface temperature for July 2015 was the highest on record at 1.35° Fahrenheit (0.75° C) above the 20th century average.
- According to NOAA’s Climate Prediction Center, strong El Niño conditions were present during July 2015. There is a greater than 90 percent chance that El Niño will continue into the Northern Hemisphere winter and an 85 percent chance it will last into spring 2016.
- Remember blues indicate cooler than average temperatures and reds indicate warmer than average temperatures (white: average).
Snow and Ice Cover Dataset
Dataset: 20150821 EarthNow: July 2015 Snow and Ice Cover
Dataset: 20150821 EarthNow: AUDIO July 2015 Snow and Ice Cover
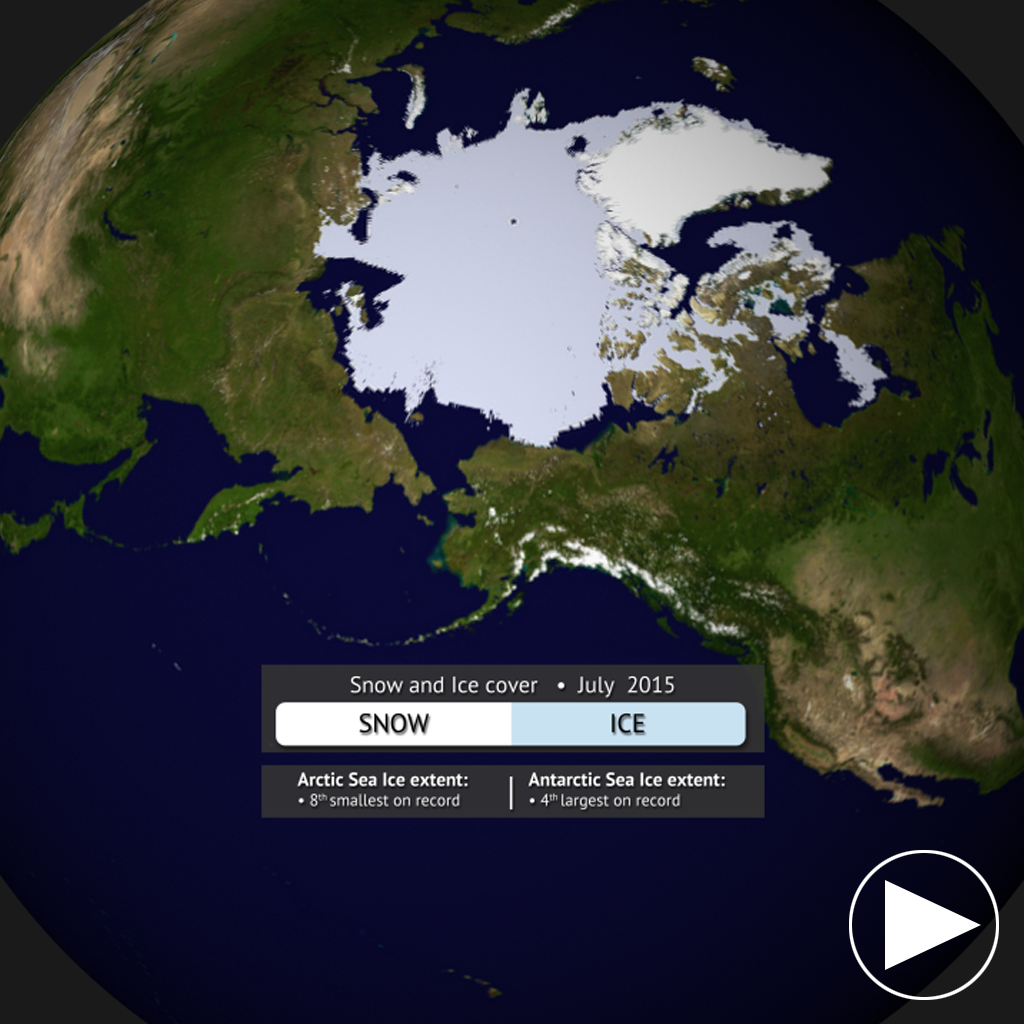
- Aside from helping to illustrate seasonal changes, the real-time Snow and Ice Cover dataset is a great way to convey sea ice change through time, including discussing how the current sea ice extent compares to other noteworthy years.
- The Arctic sea ice extent for June 2015 was 9.5% below the 1981-2010 average, making it the 8th smallest July sea ice extent since satellite records began in 1979.
- In Antarctica, the sea ice extent was 3.8% above the 1981-2010 average, the 4th largest on record for the month of July.
Seasonal Outlooks
Be sure to check out the 3-month seasonal outlooks for September – November.
- Global Temperature Outlook
- Global Precipitation Outlook
- U.S. Drought Outlook
Where do I find the datasets?
-
First, check your SOS system to make sure it’s not already in the EarthNow category.
-
In addition to the normal files, there is now a “digest” section. This section in the file structure has all of the normal files compiled into one video.
-
If not, you can download the datasets and playlist files from this FTP Site.
-
Then download and use playlist files at the top of the page (or create your own) and make sure they are in /home/sos/sosrc or /home/sosdemo/sosrc.
-
More detailed information here
Helpful Resources for More Information
-
http://go.wisc.edu/3nd6pg National Centers for Environmental Information (NCEI)
-
http://go.wisc.edu/9y2618 About ENSO (El Niño/La Niña)
-
http://go.wisc.edu/1nx2n3 NCDC’s Global Climate Report
Credits:
EarthNow Team
NOAA
References:
NOAA National Climatic Data Center, State of the Climate: Global Analysis for August 2014, published online September 2014, retrieved on September 29, 2014 from http://www.ncdc.noaa.gov/sotc/global/.


