May 2015 Climate Digest

climatedigest

Overview

Each month, we will provide information regarding the previous month’s climate. May 2015 was the warmest May since records began, with the combined average global land and ocean temperature at 1.57° Fahrenheit, or 0.87°Celsius, above the 20th century average.

Highlights Dataset

Dataset: 20150621 EarthNow: May 2015 Highlights

Dataset: 20150621 EarthNow: AUDIO May 2015 Highlights


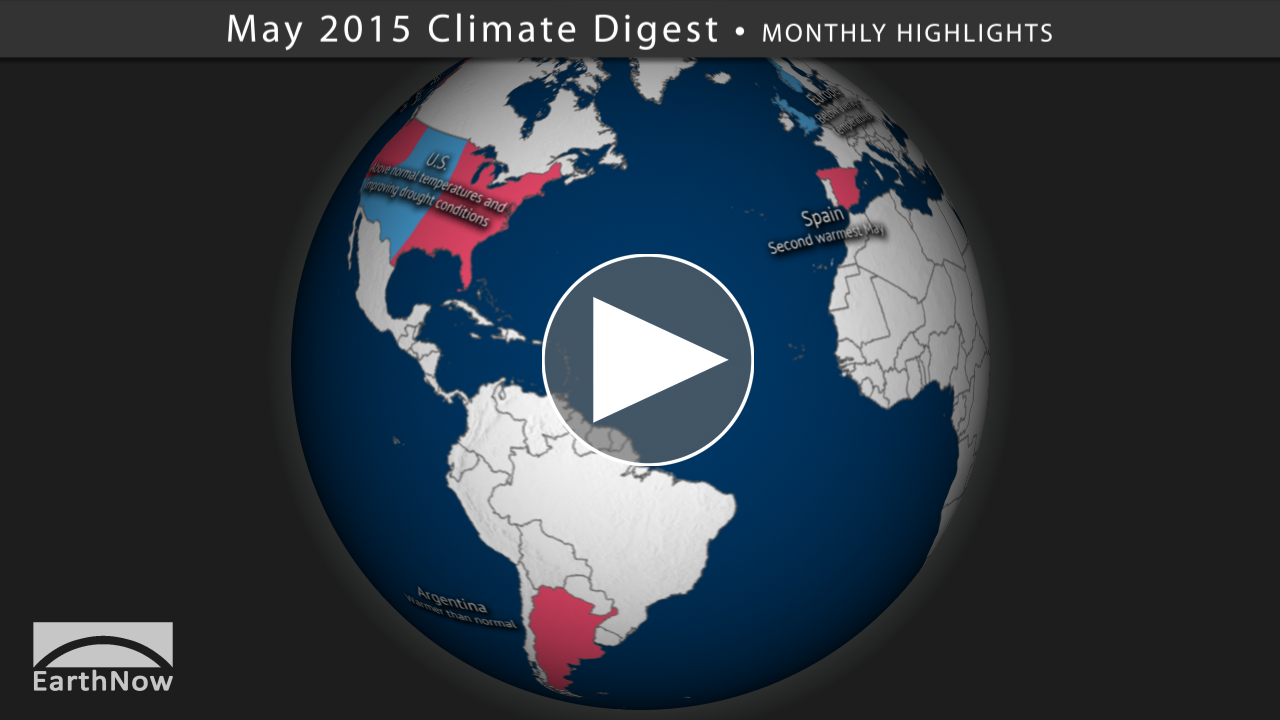
This dataset shows some of the major May weather and climate highlights from the National Climatic Data Center’s (NCDC) monthly global climate analysis, and serves as an overview of what can be discussed in the datasets that follow. Highlights are noted below.


  • Australia: Much of the country experienced below normal temperatures and precipitation.
  • India: A deadly heat wave from May 21st to 31st saw temperatures reaching up to 113° Fahrenheit (45°C).
  • Europe: Below average temperatures throughout the region.
  • Spain: second warmest May on record with temperatures averaging 4.3° Fahrenheit (2.4°C) above normal.
  • Argentina: Warmer than average conditions across much of the country. Some locations recorded their warmest April since records began more than a half a century ago.
  • United States: Nationally, temperatures were 0.6° Fahrenheit above normal. Contributing to this was the New England states of Connecticut, Massachusetts, New Hampshire and Rhode Island with observed record warmth. The May precipitation total for the contiguous U.S. was 4.36 inches, 1.45 inches above average. This was the wettest May on record and the all-time wettest month in 121-years of record keeping.
  • Alaska: Observed its warmest May in its 91-year period of record.

Sea Surface Temperature Anomalies Dataset

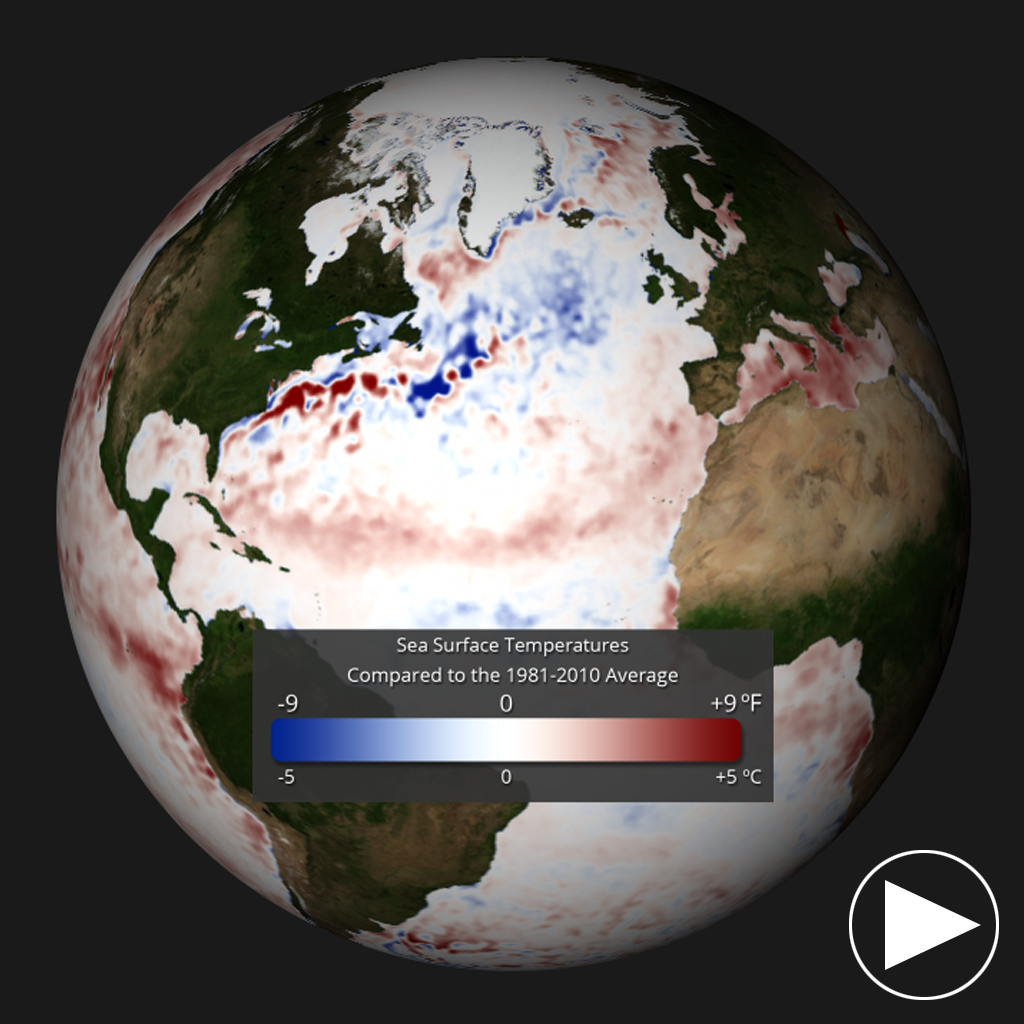
Dataset: 20150621 EarthNow: May 2015 SST Anomaly

Dataset: 20150621 EarthNow: AUDIO May 2015 SST Anomaly


  • The real-time sea surface temperature anomaly dataset is a great way to visualize the El Niño – Southern Oscillation (ENSO) in the eastern Pacific Ocean.
  • The global sea surface temperature for May 2015 was the highest on record and 1.3° Fahrenheit (0.72° C) above the 20th century average.
  • According to NOAA’s Climate Prediction Center, moderate El Niño conditions were present during May 2015. There is a greater than 90% chance that El Niño conditions will continue through the Northern Hemisphere fall, and an 85 percent chance it will last through winter.
  • Remember blues indicate cooler than average temperatures and reds indicate warmer than average temperatures (white: average).

Snow and Ice Cover Dataset

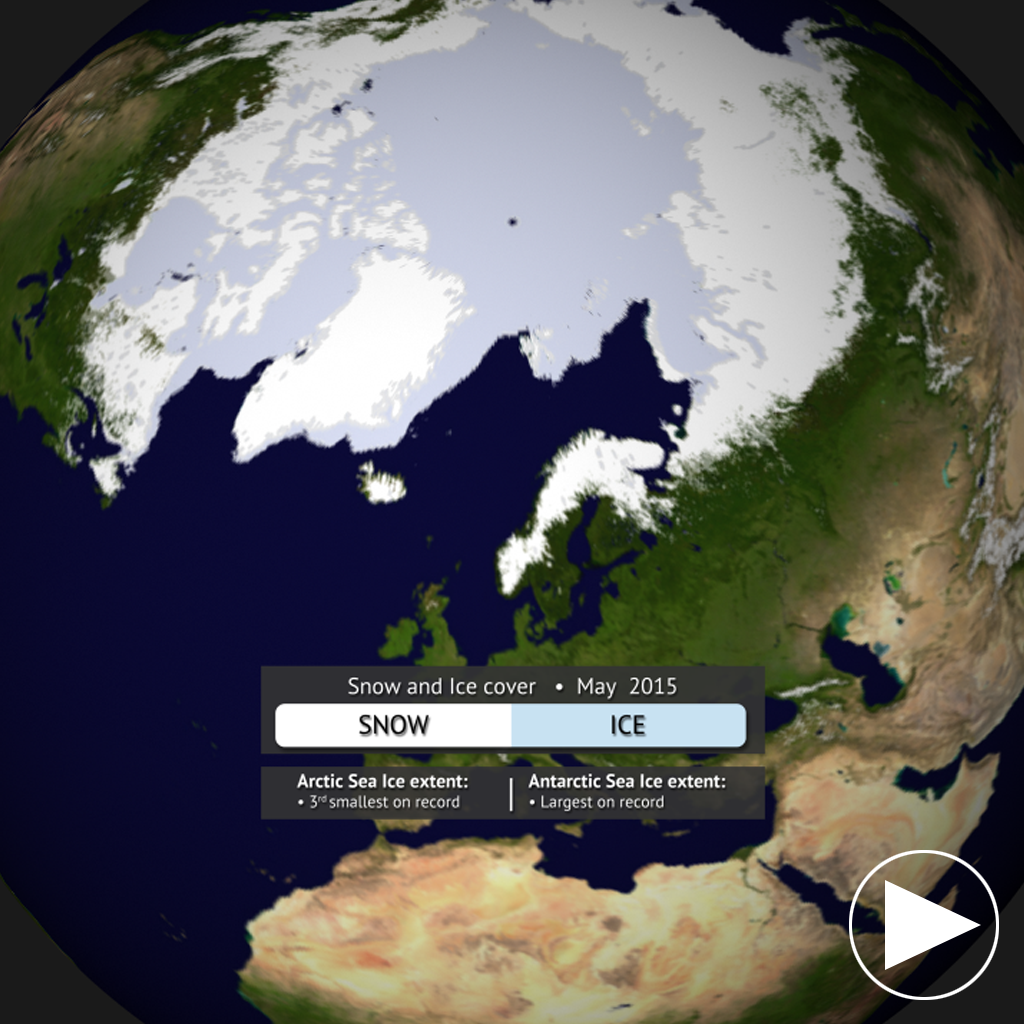
Dataset: 20150621 EarthNow: May 2015 Snow and Ice Cover

Dataset: 20150621 EarthNow: AUDIO May 2015 Snow and Ice Cover


  • Aside from helping to illustrate seasonal changes, the real-time Snow and Ice Cover dataset is a great way to convey sea ice change through time, including discussing how the current sea ice extent compares to other noteworthy years.
  • The Arctic sea ice extent for May 2015 was 5.5% below the 1981-2010 average, making it the third smallest May sea ice extent since satellite records began in 1979.
  • In Antarctica, the sea ice extent was 12.1% above the 1981-2010 average, the largest on record for the month of May.


Seasonal Outlooks

Be sure to check out the 3-month seasonal outlooks for July – September.

  • Global Temperature Outlook
  • Global Precipitation Outlook
  • U.S. Drought Outlook
Where do I find the datasets?
      • First, check your SOS system to make sure it’s not already in the EarthNow category.
      • In addition to the normal files, there is now a “digest” section. This section in the file structure has all of the normal files compiled into one video.
      • If not, you can download the datasets and playlist files from this FTP Site.
      • Then download and use playlist files at the top of the page (or create your own) and make sure they are in /home/sos/sosrc or /home/sosdemo/sosrc.
      • More detailed information here
Helpful Resources for More Information
Credits:
EarthNow Team
NOAA
References:
NOAA National Climatic Data Center, State of the Climate: Global Analysis for August 2014, published online September 2014, retrieved on September 29, 2014 from http://www.ncdc.noaa.gov/sotc/global/.

 

Category: Climate Digest

0 Comments

April 2015 Climate Digest

climatedigest

Overview

Each month, we will provide information regarding the previous month’s climate. April 2015’s combined average global land and ocean temperature was 1.33° Fahrenheit (0.74°C) higher than the 20th century average. This was the fourth highest for April in the 136-year period of record, but also, the lowest monthly departure from average since November 2014.


Highlights Dataset

Dataset: 20150521 EarthNow: April 2015 Highlights

Dataset: 20150521 EarthNow: AUDIO April 2015 Highlights


This dataset shows some of the major April weather and climate highlights from the National Climatic Data Center’s (NCDC) monthly global climate analysis, and serves as an overview of what can be discussed in the datasets that follow. Highlights are noted below.


  • Scandinavia: Some locations in Finland observed temperatures 3.6 degrees Fahrenheit (2°C) warmer than average. Sweden and Norway also experienced warmer than normal temperatures.
  • Spain: The average temperature for Spain was 3.1 degrees Fahrenheit (1.7°C) above average. Similar to the global average, Spain experienced their fourth warmest April on record since records began.
  • United States: Nationally, the average temperature for April was 2.1 degrees Fahrenheit (1.1°C) above the 20th century average. This makes April 2015 the 17th warmest April on record for the contiguous U.S.. According to the U.S. Drought Monitor, 37.4% of the contiguous U.S. was in drought at the end of April.
  • Argentina: Warmer than average conditions across much of the country. Some locations recorded their warmest April since records began more than a half a century ago.
  • Australia: Temperatures were cooler than normal in April with the mean temperature at 1.22 degrees Fahrenheit (0.68 °C) below normal, making it the 29th lowest on record.
  • Russia: Temperature readings of 9 degrees Fahrenheit (5°C) above normal.

Sea Surface Temperature Anomalies Dataset

Dataset: 20150521 EarthNow: April 2015 SST Anomaly

Dataset: 20150521 EarthNow: AUDIO April 2015 SST Anomaly


  • The real-time sea surface temperature anomaly dataset is a great way to visualize the El Niño – Southern Oscillation (ENSO) in the eastern Pacific Ocean.
  • The average April global sea surface temperature was 1.08 degrees Fahrenheit (0.60°C)  higher than the 20th century average, marking the highest global ocean temperature on record for the month.
  • According to NOAA’s Climate Prediction Center, weak-to-moderate El Niño conditions were present during April 2015. There is a 90% chance that these El Niño conditions will continue through the Northern Hemisphere summer, and more than 80% chance it will last through 2015.
  • Remember blues indicate cooler than average temperatures and reds indicate warmer than average temperatures (white: average).

Snow and Ice Cover Dataset

Dataset: 20150521 EarthNow: April 2015 Snow and Ice Cover

Dataset: 20150521 EarthNow: AUDIO April 2015 Snow and Ice Cover


  • Aside from helping to illustrate seasonal changes, the real-time Snow and Ice Cover dataset is a great way to convey sea ice change through time, including discussing how the current sea ice extent compares to other noteworthy years.
  • The Arctic sea ice extent for February 2015 was 5.5% below the 1981-2010 average, making it the second smallest April sea ice extent since satellite records began in 1979.
  • In Antarctica, the sea ice extent was 22.4% above the 1981-2010 average, the largest on record for the month of April.


Seasonal Outlooks

Be sure to check out the 3-month seasonal outlooks for June – August.

  • Global Temperature Outlook
  • Global Precipitation Outlook
  • U.S. Drought Outlook
Where do I find the datasets?
      • First, check your SOS system to make sure it’s not already in the EarthNow category.
      • In addition to the normal files, there is now a “digest” section. This section in the file structure has all of the normal files compiled into one video.
      • If not, you can download the datasets and playlist files from this FTP Site.
      • Then download and use playlist files at the top of the page (or create your own) and make sure they are in /home/sos/sosrc or /home/sosdemo/sosrc.
      • More detailed information here
Helpful Resources for More Information
Credits:
EarthNow Team
NOAA
References:
NOAA National Climatic Data Center, State of the Climate: Global Analysis for August 2014, published online September 2014, retrieved on September 29, 2014 from http://www.ncdc.noaa.gov/sotc/global/.


Category: Climate Digest

1 Comment

March 2015 Climate Digest

climatedigest

Overview

Each month, we will provide information regarding the previous month’s climate. March 2015’s combined average global land and ocean temperature was the warmest since records began in 1880, surpassing the previous record by 0.09°Fahrenheit (0.05°C) set in March 2010.


Highlights Dataset

Dataset: 20150421 EarthNow: March 2015 Highlights

Dataset: 20150421 EarthNow: AUDIO March 2015 Highlights


This dataset shows some of the major March weather and climate highlights from the National Climatic Data Center’s (NCDC) monthly global climate analysis, and serves as an overview of what can be discussed in the datasets that follow. Highlights are noted below.


  • Scandinavia: Temperatures ranged between 5 to 9 degrees Fahrenheit (3°to 5°C) warmer than average.
  • United States: The average temperature for the contiguous U.S. was 3.9°Fahrenheit above the 20th century average, making March 2015 the 12th warmest March on record.
  • Argentina: Significant precipitation values, contributing to numerous floods in the region.
  • Australia: Observed its eighth warmest March since national records began in 1910.
  • Africa: Much of Africa had warmer than average temperatures during March 2015.

Sea Surface Temperature Anomalies Dataset

Dataset: 20150421 EarthNow: March 2015 SST Anomaly

Dataset: 20150421 EarthNow: AUDIO March 2015 SST Anomaly


  • The real-time sea surface temperature anomaly dataset is a great way to visualize the El Niño – Southern Oscillation (ENSO) in the eastern Pacific Ocean.
  • The average March temperature for the global waters was the third highest for the month, at 0.55°C (0.99°F) above the 20th century average.
  • According to NOAA’s Climate Prediction Center, weak El Niño conditions were present during March 2015. There is a 70% chance that these weak-phase El Niño conditions will continue through the Northern Hemisphere summer.
  • Remember blues indicate cooler than average temperatures and reds indicate warmer than average temperatures (white: average).

Snow and Ice Cover Dataset

Dataset: 20150421 EarthNow: March 2015 Snow and Ice Cover

Dataset: 20150421 EarthNow: AUDIO March 2015 Snow and Ice Cover


  • Aside from helping to illustrate seasonal changes, the real-time Snow and Ice Cover dataset is a great way to convey sea ice change through time, including discussing how the current sea ice extent compares to other noteworthy years.
  • The Arctic sea ice extent for February 2015 was 7.3% below the 1981-2010 average, making it the smallest March sea ice extent since satellite records began in 1979.
  • In Antarctica, the sea ice extent was 24.3% above the 1981-2010 average, the second largest on record for the month of March.


Seasonal Outlooks

Be sure to check out the 3-month seasonal outlooks for May – July.

  • Global Temperature Outlook
  • Global Precipitation Outlook
  • U.S. Drought Outlook
Where do I find the datasets?
      • First, check your SOS system to make sure it’s not already in the EarthNow category.
      • If not, you can download the datasets and playlist files from this FTP Site.
      • Then download and use playlist files at the top of the page (or create your own) and make sure they are in /home/sos/sosrc or /home/sosdemo/sosrc.
      • More detailed information here
Helpful Resources for More Information
Credits:
EarthNow Team
NOAA
References:
NOAA National Climatic Data Center, State of the Climate: Global Analysis for August 2014, published online September 2014, retrieved on September 29, 2014 from http://www.ncdc.noaa.gov/sotc/global/.
 

Category: Climate Digest

2 Comments