Each month, we will provide information regarding the previous month’s climate. Overall, preliminary data analysis suggests that August 2012 was the 4th warmest August on record (since 1880). Major stories include a warm summer for the contiguous United States, cool Australia, several typhoons, Hurricane Isaac, and continued neutral conditions for El Niño and La Niña. More detailed information follows.
August 2012 Highlights
This dataset shows some of the major August weather and climate highlights from the National Climatic Data Center’s (NCDC) monthly global climate analysis. The events are noted below with more information.
- El Niño/Southern Oscillation (ENSO): Neutral (not El Niño or La Niña) conditions prevailed in the eastern tropical Pacific Ocean. It should be noted, however, that water temperatures in the region are above normal, just not to the El Niño threshold. Click here for more information about ENSO and how it may impact the climate outlook for the coming months.
- Contiguous United States: Warmest summer (June-August) on record (since 1895). Warmest January-August period on record.
- Hurricane Isaac: (August 21 – September 1), Max. Winds: 130 km/hr. Heavy rain, strong winds, and floods to the Caribbean and southern U.S. 34 fatalities resulted from Isaac in Hispaniola and 9 in the United States.
- Eastern Argentina: Heavy rain from several storms. Some areas received their highest precipitation amounts in 51 years.
- United Kingdom: Second wettest summer on record.
- Spain: Second warmest August since 1961.
- Finland: Coolest summer since 2008.
- Typhoon Tembin: (August 17 – 30), Maximum Winds: 215 km/hr, Tembin caused heavy rains and affected Taiwan twice. 167.5 mm of rain fell in one hour on August. 24th.
- Typhoon Bolaven: (August 19-29), Maximum Winds: 230 km/hr, The strongest typhoon to hit the Korean Peninsula in about 10 years.
- Australia: Third coolest August minimum temperatures on record (0.91˚C, 1.64˚F).

August SST Anomalies
Sea Surface Temperature Anomalies (Differences from Average)
- The real-time sea surface temperature anomaly dataset is a great way to visualize moderating water temperatures in the eastern tropical Pacific ocean. This helps show the warmer waters, indicating the loss of La Niña and potential transition to an El Niño period.
- Remember that the blues indicate cooler than average temperatures and reds indicate warmer than average temperatures (white: average).
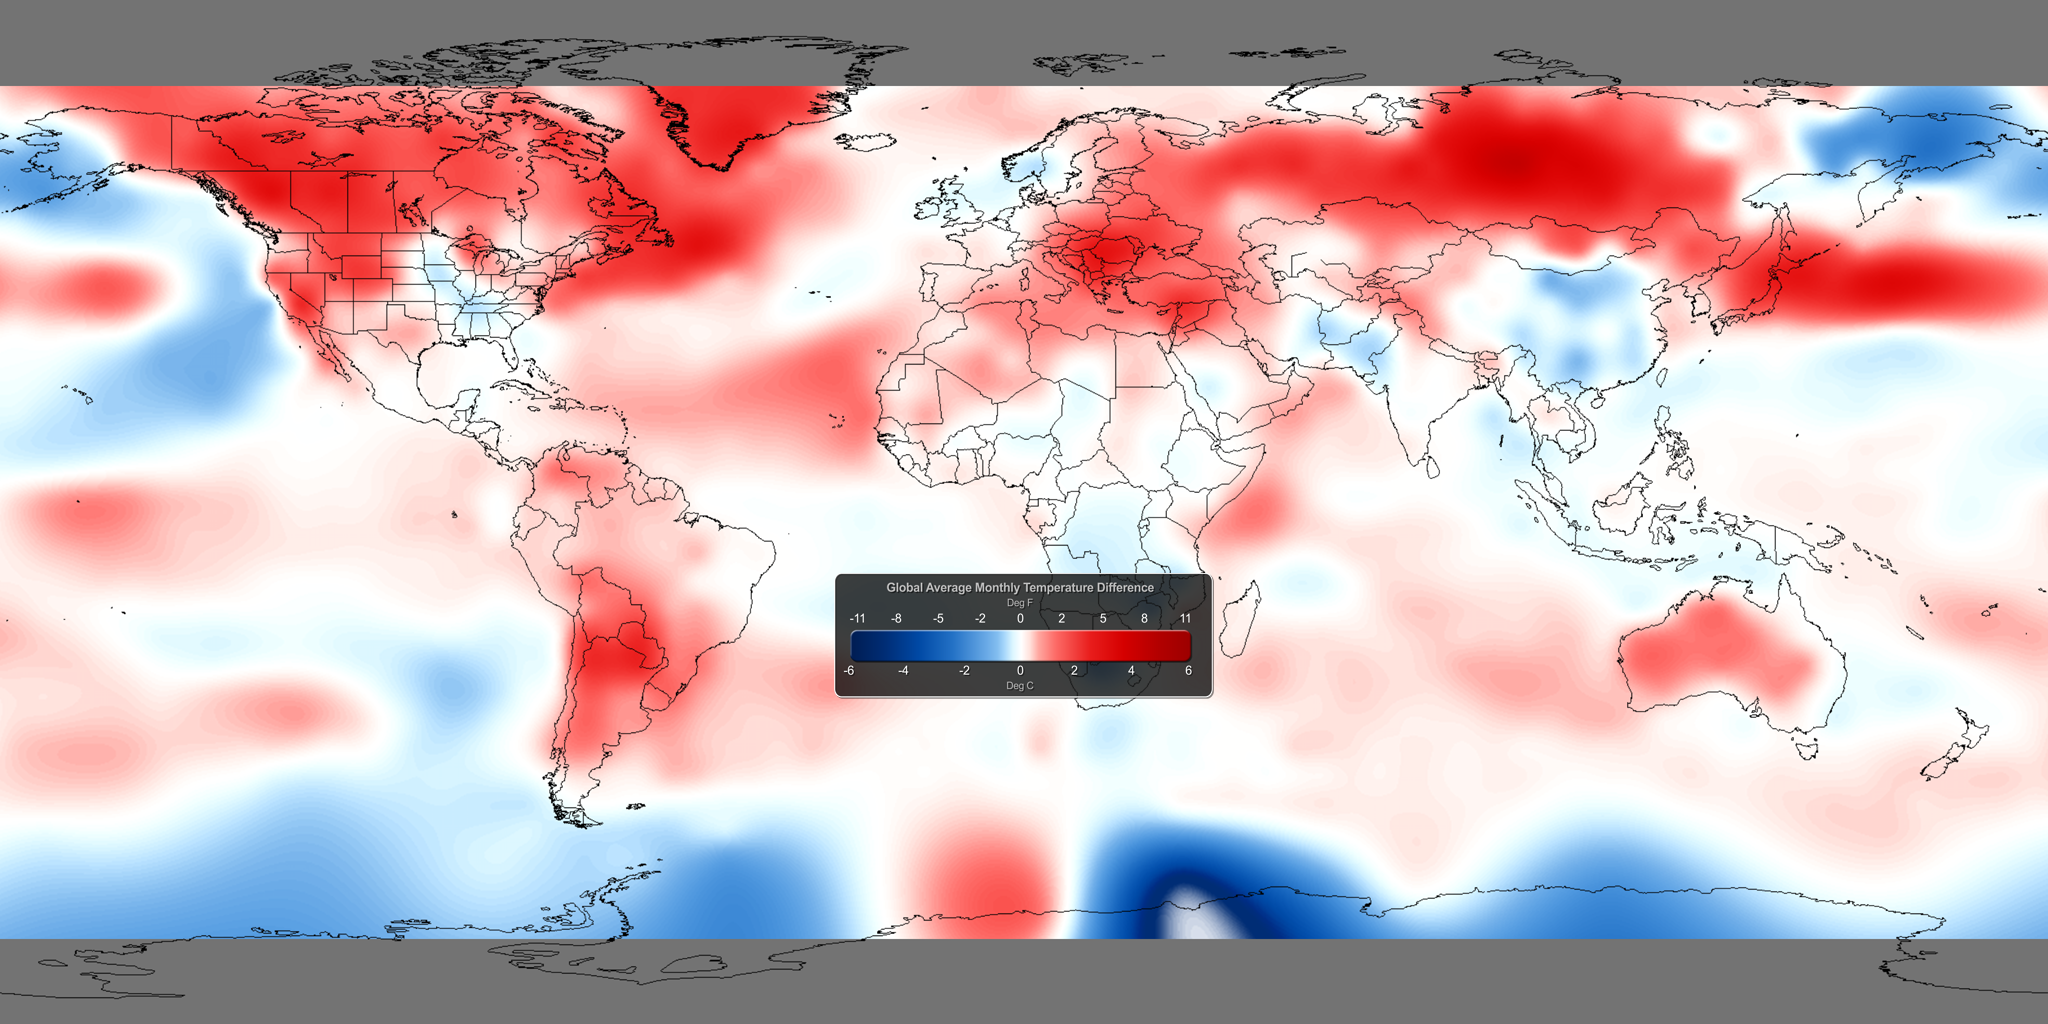
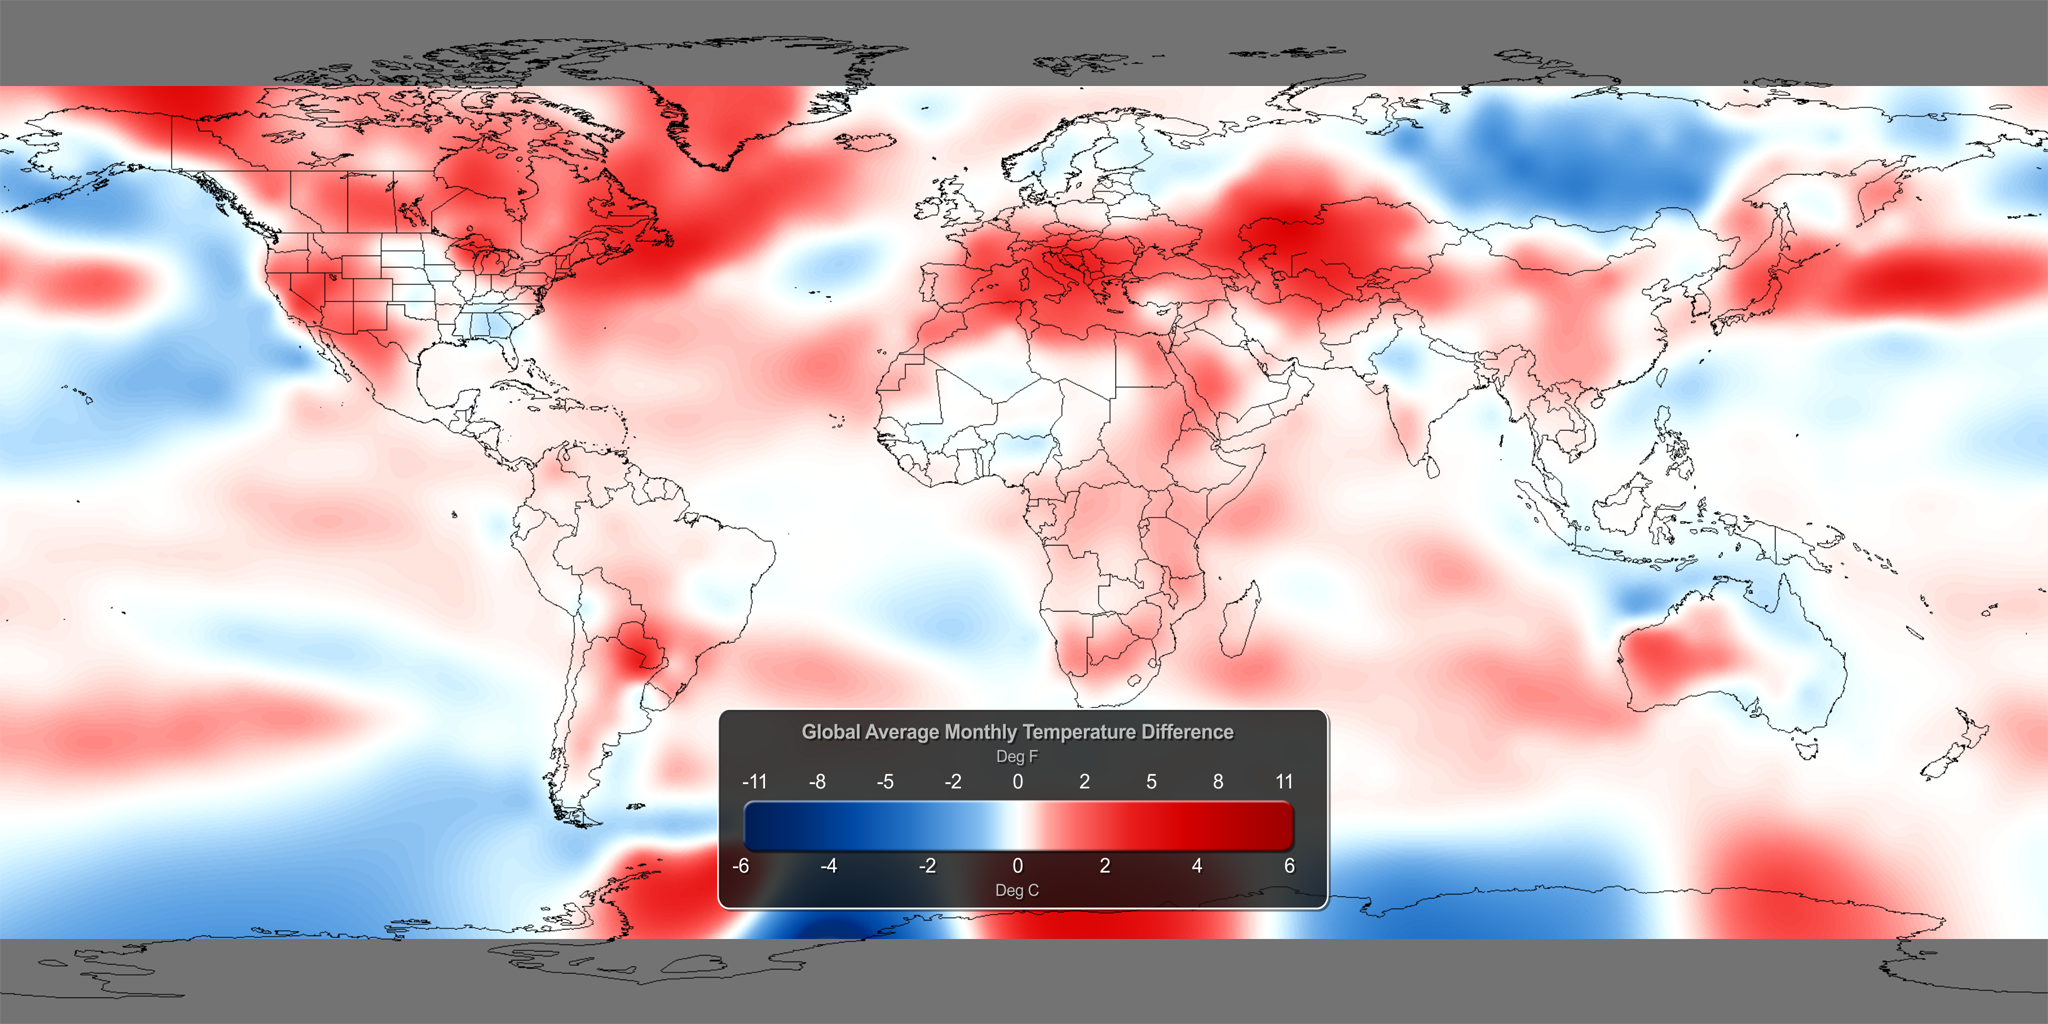
Global Monthly Temperature Anomalies
- Using the real-time Monthly Temperature Anomalies dataset is a great way to convey where some of the warmer and cooler than average areas were in July.
- The combined global land and ocean average surface temperature for August 2012 was the 4th warmest on record.
- Please see the “August 2012 Fourth Warmest on Record” post for more information.

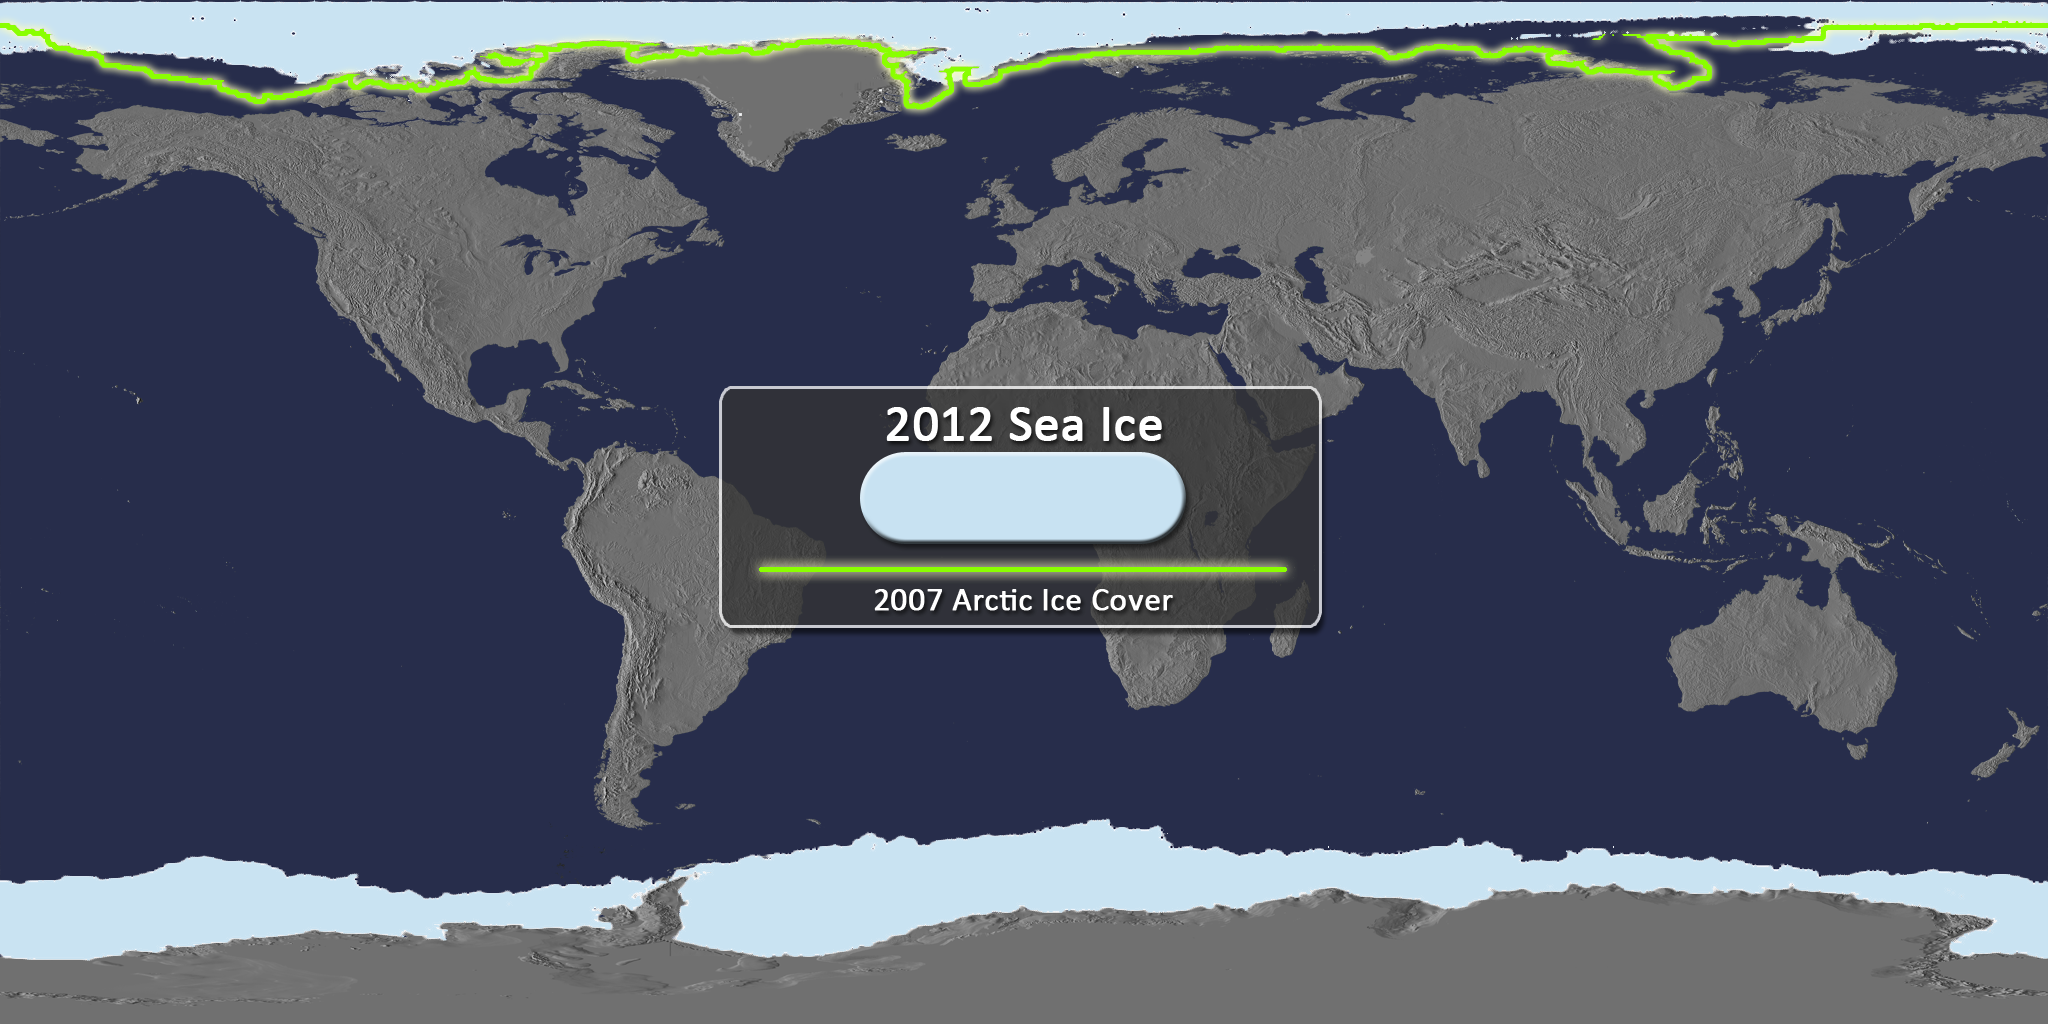
August 2012 Snow and Ice
Snow and Ice Cover
- Aside from helping to illustrate seasonal changes, the real-time Snow and Ice Cover dataset is a great way to convey sea ice change through time, including discussing how the current sea ice extent compares to other noteworthy years.
- The Arctic sea ice extent in August was the smallest on record. The extent was 38.5% below the 1979-2000 average.
- In Antarctica, the August sea ice extent was the 4th largest on record, at 1.6% above the 1979-2000 average.
Where do I find the datasets?
- First, check your SOS system to make sure they are not already in the EarthNow category. There is also an earthnow.sos playlist file that includes a playlist with all of these datasets.
- If not, you can download the datasets and playlist files from this FTP Site.
Helpful Resources for More Information
Credits:
CIMSS/SSEC, UW-Madison
NOAA
References:
NOAA National Climatic Data Center, State of the Climate: Global Analysis for August 2012, published online September 2012, retrieved on September 17, 2012 from http://www.ncdc.noaa.gov/sotc/global/2012/8.

 About the Dataset
 Still Map Image
 Play Dataset SOS Preview


