
While much of the United States is currently experiencing cooler than average temperatures, NOAA’s Climate Prediction Center is expecting autumn as a whole to be warmer than normal for much of the country. The southeastern United States is also expected to receive more precipitation than normal. Read on for more information.

U.S. Temperature Outlook • Animation not work? Click Here • Still Map Image
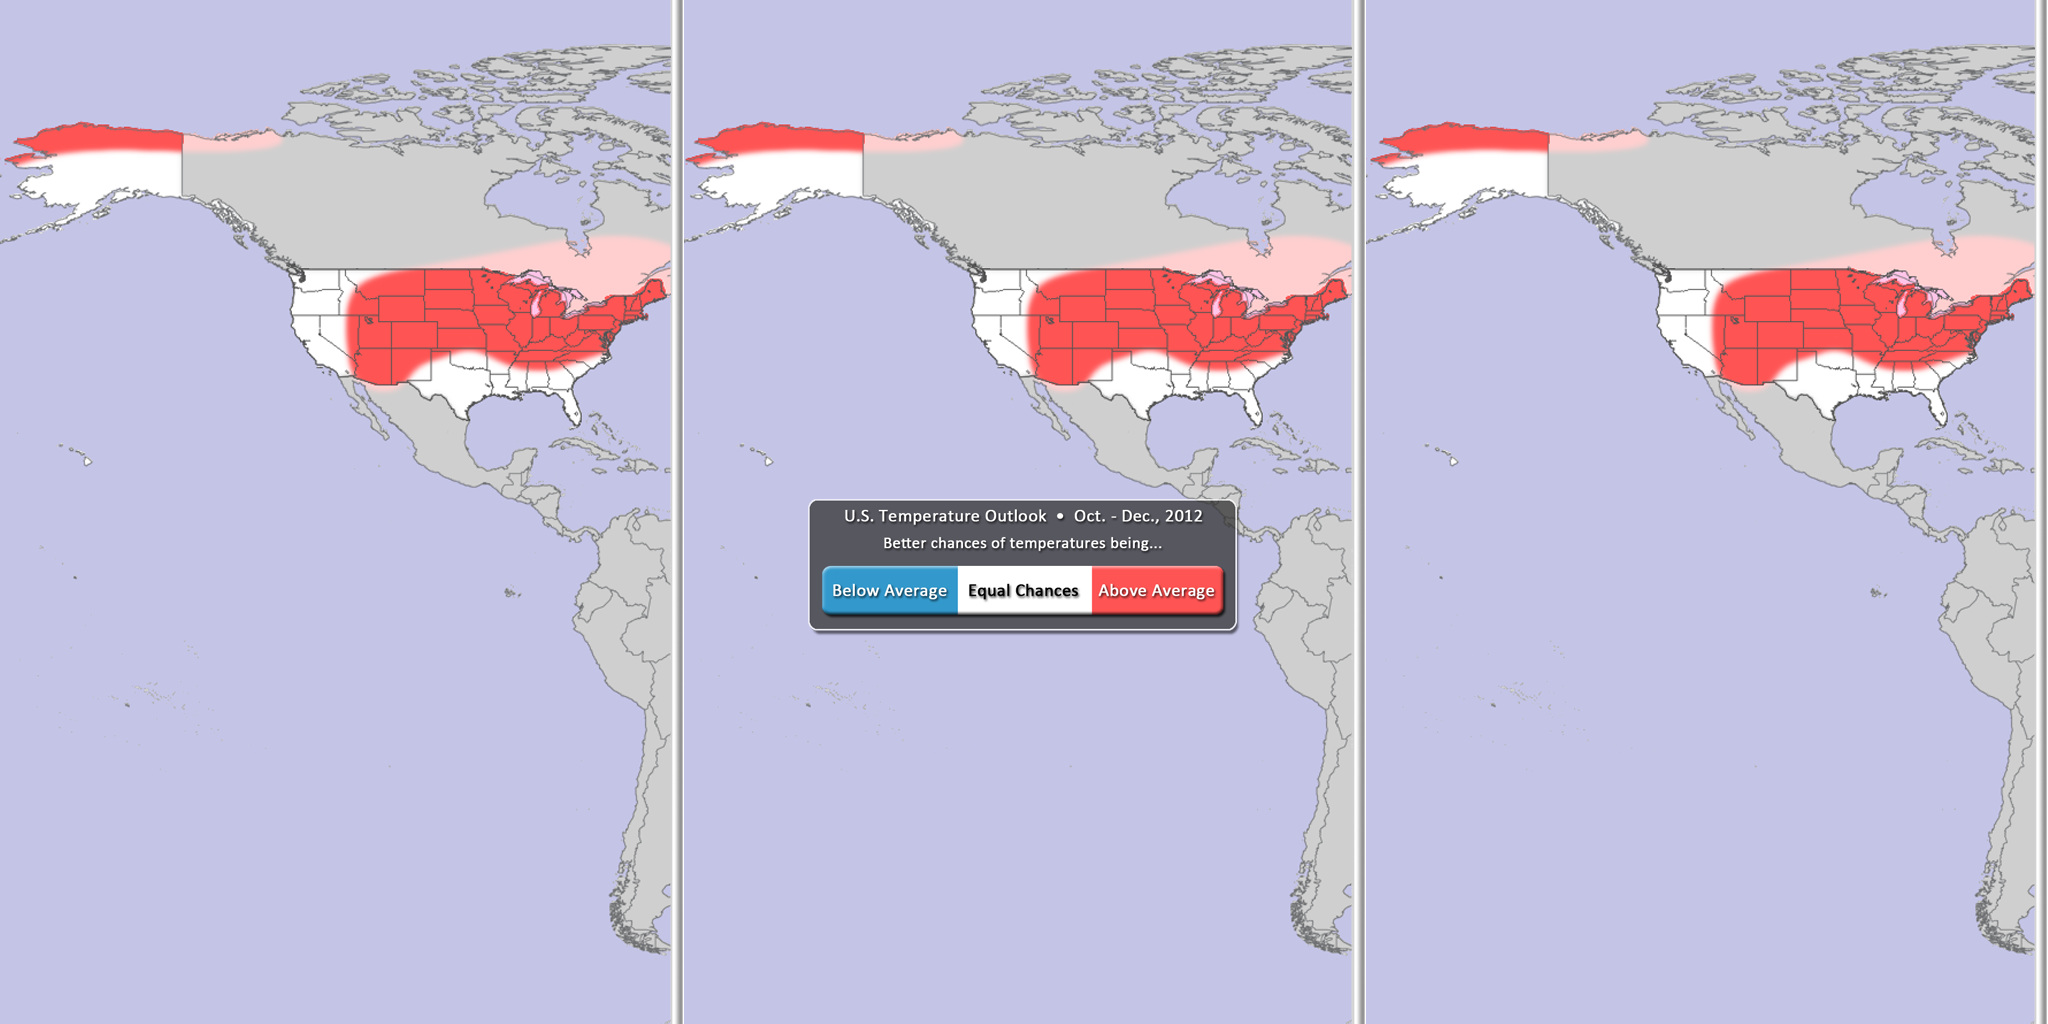
U.S. Temperature Outlook
- Sea Surface Temperatures in the ENSO (El Niño Southern Oscillation) region suggest continued neutral conditions, but may be giving way to an El Niño by the end of the summer or early fall, according to the Climate Prediction Center.
- For the October – December period, warmer than normal temperatures are expected across from the desert southwest up through the northern and central plains and into the Mid-Atlantic and Northeastern states. Northern Alaska is also expected to be warmer than normal. Below normal temperatures aren’t expected for anywhere in the U.S.
- All other locations (in white) have equal chances of being warmer or cooler than normal.
- Outlook by NOAA’s Climate Prediction Center (CPC)
- In its forecasts, the CPC uses a wide variety of models in conjunction with looking at climate variables (like El Niño).
- It should be noted that areas in the “warmer than normal” region may still have cooler than normal days. This outlook only suggests that after the three months are over, those areas in the “warmer than normal” region are more likely to have experienced warmer than normal average temperatures.

U.S. Precipitation Outlook • Animation not work? Click Here • Still Map Image
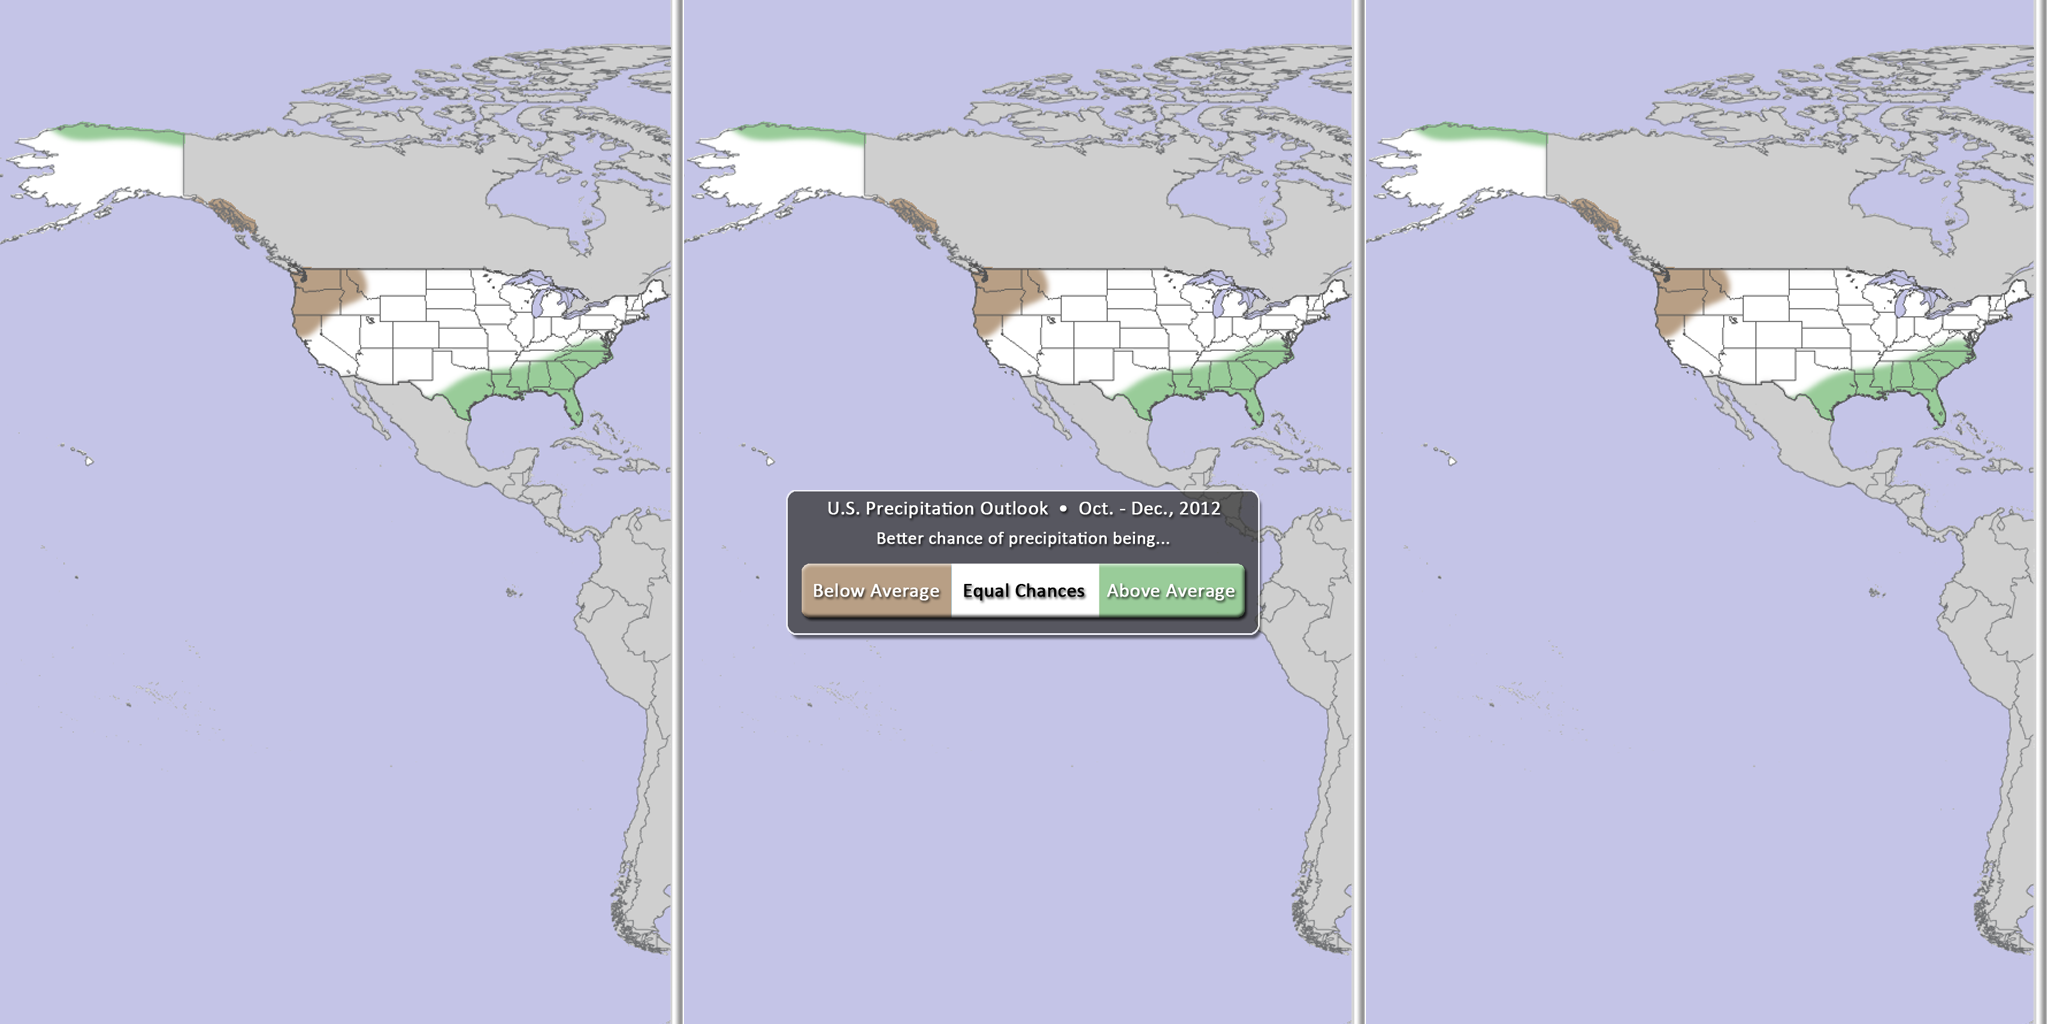
U.S. Precipitation Outlook
- For the next three months (October – December), drier than normal conditions are expected for the Pacific Northwest.
- Wetter than normal conditions are expected in the Southeastern U.S., as well as northern Alaska.
- All other locations (in white) have equal chances of being wetter or drier than normal.
- Outlook by NOAA’s Climate Prediction Center (CPC)
- In its forecasts, the CPC uses a wide variety of models in conjunction with looking at climate variables (like El Niño).
- It should be noted that areas be in the “drier than normal” region may still have rainy days. This outlook only suggests that after the three months are over, those areas in the “drier than normal” region are more likely to have experienced drier than normal averages.
Where do I find the datasets?
- First, check your SOS system to make sure they are not already in the EarthNow category. There is also an earthnow.sos playlist file that includes a playlist with all of these datasets.
- If not, you can download the datasets and playlist files from this FTP Site.
Helpful Resources for More Information
- http://www.cpc.ncep.noaa.gov/products/predictions/90day/fxus05.html NOAA CPC Outlook Discussion
- http://www.ncdc.noaa.gov/sotc/briefings NOAA Climate Report Briefings


