
Each month, we will provide information regarding the previous month’s climate. Overall, preliminary data analysis suggests that July 2012 was the 4th warmest July on record (since 1880). Major stories include a warm contiguous United States, cool Australia, several typhoons, and continued neutral conditions for El Niño and La Niña. More detailed information follows.

July 2012 Highlights • Animation not work? Click here • Still Map Image
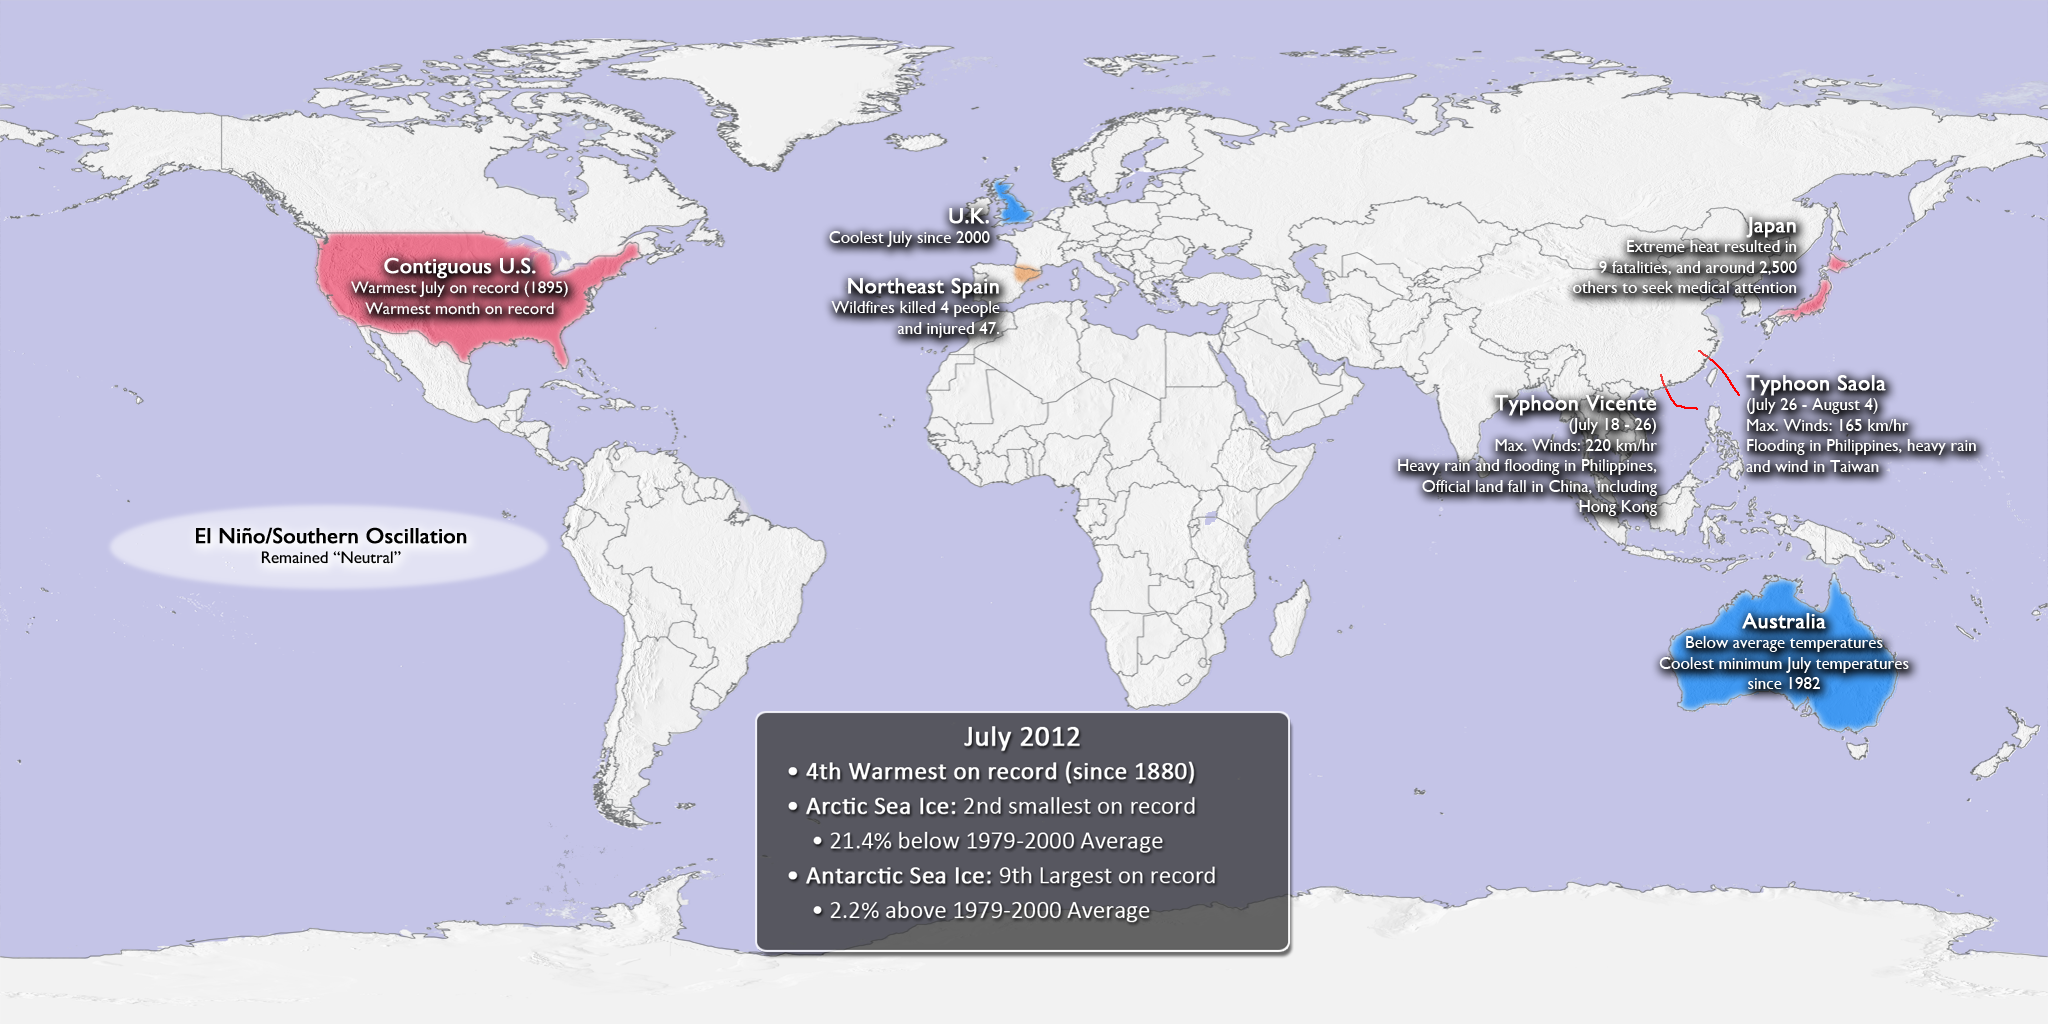
July 2012 Highlights
- This dataset shows some of the major July climate highlights from the National Climatic Data Center’s (NCDC) monthly global climate analysis. The events are noted below with more information.
- El Niño/Southern Oscillation (ENSO): Neutral (not El Niño or La Niña) conditions prevailed in the eastern tropical Pacific Ocean. It should be noted, however, that water temperatures in the region are above normal, just not to the El Niño threshold. Meteorologists are suggesting that we may transition to an El Niño by the end of summer or early fall. Click here for more information about ENSO and how it may impact the climate outlook for the coming months.
- Contiguous United States: Warmest July on record (since 1895), as well as the warmest month on record.
- United Kingdom: Coolest July since 2000
- Spain: Northeastern Spain experienced wildfires, further exacerbating the worst year for forest fires in over a decade for the country. The fires resulted in 4 fatalities and 47 injuries.
- Japan: Extreme heat in Japan resulted in 9 fatalities and nearly 2,500 people seeking medical attention.
- Typhoon Saola: (July 26 – August 4), Maximum Winds: 165 km/hr, Saola caused flooding in the Philippines and in Taiwan. The rains in Taiwan also resulted in mudslides.
- Typhoon Vicente: (July 18 – 26), Maximum Winds: 220 km/hr, Vicente caused heavy rains and flooding in the northern Philippines before making landfall in southern China, where strong winds and rain wreaked havoc on Hong Kong.
- Australia: Cooler than average temperatures allowed Australia to experience its coolest July minimum (low) temperatures since 1982.

July 2012 SST Anomalies
Sea Surface Temperature Anomalies (Differences from Average)
- The real-time sea surface temperature anomaly dataset is a great way to visualize moderating water temperatures in the eastern tropical Pacific ocean. This helps show the warmer waters, indicating the loss of La Niña and potential transition to an El Niño period.
- Remember that the blues indicate cooler than average temperatures and reds indicate warmer than average temperatures (white: average).

July 2012 Global Temperature Anomalies • Animation not work? Click here • Still Map Image
Global Monthly Temperature Anomalies
- Using the real-time Monthly Temperature Anomalies dataset is a great way to convey where some of the warmer and cooler than average areas were in July.
- The combined global land and ocean average surface temperature for July 2012 was the 4th warmest on record at 16.42˚C (61.52˚F), which is 0.62˚C (1.12˚F) above the 20th century average.
- The combined global land and ocean average surface temperature for January–July 2012 was the 10th warmest on record.
- Please see the “July 2012 Fourth Warmest on Record” post for more information.

July 2012 Snow and Ice
Snow and Ice Cover
- Aside from helping to illustrate seasonal changes, the real-time Snow and Ice Cover dataset is a great way to convey sea ice change through time, including discussing how the current sea ice extent compares to other noteworthy years.
- The Arctic sea ice extent in July was the second smallest on record. The extent was 21.4% below the 1979-2000 average.
- In Antarctica, the July sea ice extent was the 9th largest on record, at 2.2% above the 1979-2000 average.
Where do I find the datasets?
- First, check your SOS system to make sure they are not already in the EarthNow category. There is also an earthnow.sos playlist file that includes a playlist with all of these datasets.
- If not, you can download the datasets and playlist files from this FTP Site.
Helpful Resources for More Information
- http://www.ncdc.noaa.gov/oa/ncdc.html National Climatic Data Center (NCDC)
- http://www.ncdc.noaa.gov/teleconnections/enso/enso-tech.php About ENSO (El Niño/La Niña)
- http://www.ncdc.noaa.gov/sotc/global/ NCDC’s Global Climate Report


