While those of us in the Northern Hemisphere are settling into Autumn, increased sunshine is making a rebound in the Southern Hemisphere. This may sound pleasant, but the increased sunshine along with other factors is what leads to the “ozone hole” many of us have heard of over the Antarctic. During the cold dark winters, temperatures drop below -78ºC (-108 F), promoting the production of of chemically active chlorine and bromine. When sunlight is combined with the chlorine and bromine in the Antarctic Spring, there is a reaction that leads to the breakdown of ozone, resulting in the Antarctic ozone hole (holes are areas with ozone concentrations of less than 220 Dobson Units). Feel free to use the information and datasets below to enhance your SOS presentation.
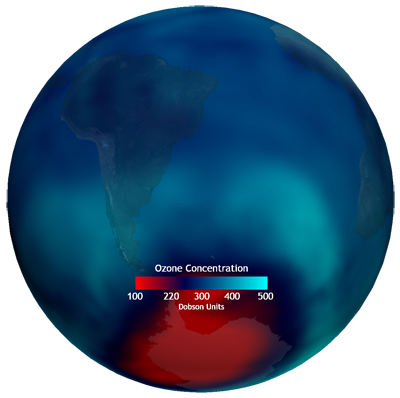
Visualizing “Real-time Stratospheric Ozone“.

- Overall, you will be able to use this dataset to show the changing ozone concentration, including the formation of the “ozone hole” starting in August.
- The “ozone hole” is anything represented in red (below 220 Dobson Units).
- Relatively low concentrations of ozone along the equator, as atmospheric circulations push ozone away from the equator towards the poles.
- Note: If you would like to use this dataset, it should already be available on your SOS system via the RT (real-time) datasets.
Stratospheric Ozone.
Ozone is a gas made of three oxygen atoms, and just like any other gas it circulates in the atmosphere. The stratospheric ozone layer is critical because it protects Earth from harmful ultraviolet solar radiation. Areas with ozone concentrations less than 220 Dobson Units are called “holes” in the layer. The Antarctic ozone hole is formed each year in the Southern Hemisphere spring (September-November) when there is a sharp decline (currently up to 60%) in the total ozone over most of Antarctica. During the cold dark Antarctic winter, stratospheric ice clouds form when temperatures drop below -78C. These very cold clouds are responsible for chemical changes that promote production of chemically active chlorine and bromine. When sunlight is combines with the chlorine and bromine in the Antarctic Spring, there is a chemical reaction that changes ozone (O3) to regular oxygen (O2). If this reaction occurs a lot, a hole forms. Although some ozone depletion also occurs in the Arctic during the Northern Hemisphere spring (March-May), wintertime temperatures in the Arctic stratosphere are not persistently low for as many weeks which results in less ozone depletion. The production of ozone is high near the equator, but due to atmospheric circulation transporting the ozone to the poles, the equator tends to be a region of relatively low ozone through the year.
Scientific evidence, accumulated over more than two decades of study by the international research community, has shown that human-produced chemicals are responsible for the observed depletions of the ozone layer. The ozone-depleting compounds contain various combinations of the chemical elements chlorine, fluorine, bromine, carbon, and hydrogen and are often described by the general term halocarbons. Through an international agreement known as the Montreal Protocol on Substances that Deplete the Ozone Layer, governments have decided to eventually discontinue production of CFCs, halons, carbon tetrachloride, and methyl chloroform (except for a few special uses), and industry has developed more “ozone-friendly” substitutes. All other things being equal, and with adherence to the international agreements, the ozone layer is expected to recover over the next 50 years or so. NOAA’s polar orbiting satellites are used to monitor the ozone hole and the data taken from the POES satellites is processed and made available on a daily basis in near real-time.
Influence of the Changing Seasons on Ozone
At this point, I don’t have a corresponding visualization for this topic, but it should be noted. Why does the hole become larger during the spring, but not into the summer, if increased sun exposure is part of the cause of the growing ozone hole each year? Well, the increased sun energy is just a part of the reason. The extremely cold temperatures coming out of winter is the other reason. Chlorine and Bromine, chemicals that are relatively stable under normal conditions, become chemically active due to extremely cold conditions. This is no longer the case as spring moves closer to summer, allowing the ozone to “fill” back in.
Polar stratospheric clouds and ozone
Under normal atmospheric conditions, the two chemicals that store most atmospheric chlorine (hydrochloric acid, and chlorine nitrate) are stable. But in the long months of polar darkness over Antarctica in the winter, atmospheric conditions are unusual. An endlessly circling whirlpool of stratospheric winds called the polar vortex isolates the air in the center. Because it is completely dark, the air in the vortex gets so cold that clouds form, even though the Antarctic air is extremely thin and dry. Chemical reactions take place that could not take place anywhere else in the atmosphere. These unusual reactions can occur only on the surface of polar stratospheric cloud particles, which may be water, ice, or nitric acid, depending on the temperature.
These reactions convert the inactive chlorine reservoir chemicals into more active forms, especially chlorine gas (Cl2). When the sunlight returns to the South Pole in October, UV light rapidly breaks the bond between the two chlorine atoms, releasing free chlorine into the stratosphere, where it takes part in reactions that destroy ozone molecules while regenerating the chlorine (known as a catalytic reaction). A catalytic reaction allows a single chlorine atom to destroy thousands of ozone molecules. Bromine is involved in a second catalytic reaction with chlorine that contributes a large fraction of ozone loss. The ozone hole grows throughout the early spring until temperatures warm and the polar vortex weakens, ending the isolation of the air in the polar vortex. As air from the surrounding latitudes mixes into the polar region, the ozone-destroying forms of chlorine disperse. The ozone layer stabilizes until the following spring.
How this Year Stacks Up…

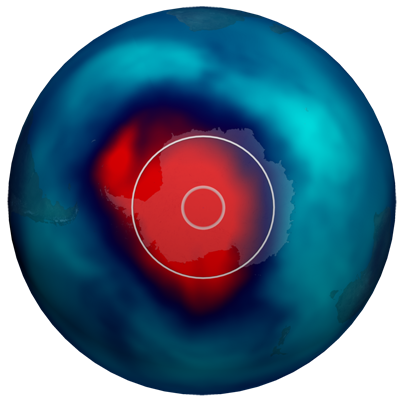
- This dataset shows the October 10, 2011 data along with circles illustrating the areas of the ozone holes in 1981 (inner circle) and 1991 (outer circle).
- 1981 maximum area: 1.3 Million Square Kilometers
- 1991 maximum area: 21 Million Square Kilometers
- 2011 maximum area: 25-26 Million Square Kilometers
- For comparison: The United States is 9.36 Million Square Kilometers
- It should be noted that all other things being equal, and with adherence to international agreements regarding CFCs, the ozone layer is expected to recover over the next 50 years or so. For more information about that, check out AMNH’s SOS production, “Ozone’s Slow Recovery.”
- Note: If you wish to use this dataset as part of your presentation, you may need to download the files (see below) onto your system. We are trying to “push” the EarthNow playlist information to your systems, so please let me know if you DO “magically” have EarthNow playlists and datasets on your system.
Helpful Resources for more information:
- http://sos.noaa.gov/datasets/Atmosphere/ozone.html
- http://www.cpc.ncep.noaa.gov/products/stratosphere/sbuv2to/ozone_hole.shtml
- http://www.ozonelayer.noaa.gov/
- http://ozonewatch.gsfc.nasa.gov/facts/hole_SH.html
- http://earthobservatory.nasa.gov/IOTD/view.php?id=60598
Where do I get that really cool Ozone Comparison Dataset?
- First, check your SOS system to make sure it’s not already in an EarthNow playlist. As this is a very new project, we are experimenting with how to provide the visualizations. It might already be there.
- If not, you can download the dataset and playlist.sos file from this FTP Site.
Well, that wraps up the inaugural EarthNow blog entry. Please use the Contact link above to send me any feedback. Thank you!


