Each month, we will provide information regarding the previous month’s climate (this post was originally to be done in October), as well as the climate outlook for the coming months. Overall, preliminary data analysis suggests that September was the 8th warmest on record. Major stories include La Niña’s return and the Arctic sea ice annual minimum being the second smallest on record. More detailed information follows:
 September 2011 Major Events
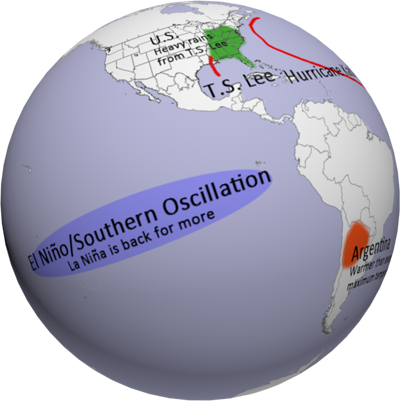
- This dataset highlights some of the major September events from the National Climatic Data Center’s (NCDC) monthly global climate analysis. The events are noted below with more information.
- El Niño/Southern Oscillation: Cooler than average waters in the eastern Pacific Ocean mean that La Niña has returned. Click here for more information about La Niña and how it may impact the outlook for the forthcoming Winter season.
- Tropical Storm Lee was the 12th named storm of the 2011 Atlantic hurricane season, bringing with it rainfall totals of over 10 inches and damaging winds in some parts of the eastern third of the U.S. (Dates: Sep. 1-5)
- Argentina‘s northern and west-central regions experienced warmer-than-average maximum temperatures, resulting in the warmest average maximum September temperature in 50 years.
- Hurricane Katia was the 11th named storm of the 2011 Atlantic hurricane season. After becoming extratropical, the storm impacted the United Kingdom with strong winds. (Dates: Aug. 29-Sep. 10)
- The United Kingdom had its warmest September since 2006 and the sixth warmest in the last 100 years.
- Spain experienced its driest September since 1988.
- China‘s Sichuan, Henan, and Shaanxi provinces experienced over a week of heavy rains, leading to deadly floods.
- Typhoon Talas brought heavy rain and winds to western Japan and is being reported as the deadliest cyclone to hit Japan since 2004. (Dates: Aug. 23-Sep. 5)
- Australia‘s September 2011 minimum temperature was the coolest since 1985. Also of note, Australia’s daily temperature range was wider than normal.
En Español
Este conjunto de datos pone de relieve algunos de los principales acontecimientos de septiembre de (CNDC) el análisis mensual de la National Climatic Data Center del clima global. Los eventos se indican a continuación con más información.
- El Niño / Oscilación del Sur: temperaturas más bajas del promedio en el Océano Pacífico oriental decir que La Niña ha vuelto, y cómo pueden afectar las perspectivas para la temporada de invierno próxima.
- La tormenta tropical Lee fue nombrado el 12 de la tormenta de la temporada 2011 de huracanes del Atlántico, trayendo consigo los totales de lluvia de más de 10 pulgadas y vientos dañinos en algunas partes del tercio oriental de los EE.UU. (Fechas: Sep. 1-5)
- Regiones del norte y centro-oeste de la Argentina ha experimentado más cálidas que el promedio de temperaturas máximas, lo que resulta en el más cálido de la temperatura media máxima de septiembre en 50 años.
- Huracán Katia fue la tormenta del 11 de nombre de la temporada 2011 de huracanes del Atlántico. Después de convertirse en extratropical, la tormenta impactó el Reino Unido, con fuertes vientos. (Fechas:. Agosto 29-septiembre 10)
- El Reino Unido tuvo su más cálido desde 2006 y septiembre los más cálidos en sexto lugar en los últimos 100 años.
- España, la sequía desde septiembre desde 1988.
- China de Sichuan, Henan y Shaanxi experimentado más de una semana de fuertes lluvias, dando lugar a inundaciones.
- Tifón Talas trajo fuertes lluvias y vientos de oeste Japón y se presenta como el más mortífero ciclón que afectó a Japón desde 2004. (Fechas:. 23 agosto-5 septiembre)
- Septiembre de 2011 Australia temperatura mínima fue el más frío desde 1985. También los (ºC) de amplitud térmica diaria, fue en Australia el más alto de lo normal.
 Sea Surface Temperature Anomaly
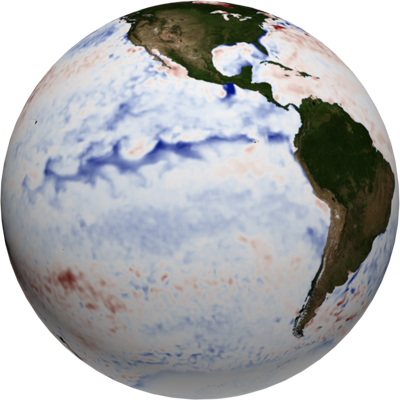
- The real-time sea surface temperature anomaly dataset is a great way to visualize the cooler than normal waters in the eastern Pacific ocean.
- Remember that the blues indicate cooler than average temperatures and reds indicate warmer than average temperatures (white: average), not simply cool or warm. 3 million degrees is hot. 2 million degrees is also hot, but well below average.
 Global Temperature Anomalies
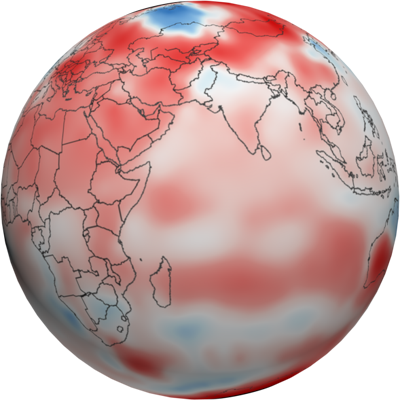
- Using the real-time Monthly Temperature Anomalies dataset is a great way to convey where some of the warmer and cooler than average areas were in September.
- The combined global land and ocean average surface temperature for September 2011 was the 8th warmest on record at 15.53ºC (59.95ºF), which is 0.53ºC (0.95ºF) above the 20th century average.
- The combined global land and ocean average surface temperature for the January-September period was 0.51ºC (0.92ºF) above the 20th century average, making it the 11th warmest on record.
 Snow and Ice… brrrr!
- Aside from helping to illustrate seasonal changes, the real-time Snow and Ice Cover dataset is a great way to convey sea ice change through time, including the Arctic’s annual minimum, which just so happens to be in September!
- This year, the Arctic’s sea ice reached its minimum on September 9th. It was the second lowest on record (behind 2007) at 34.5% below the 1979-2000 average.
- The Antarctic sea ice extent in September was the 14th largest on record at 0.1% above the 1979-2000 average.
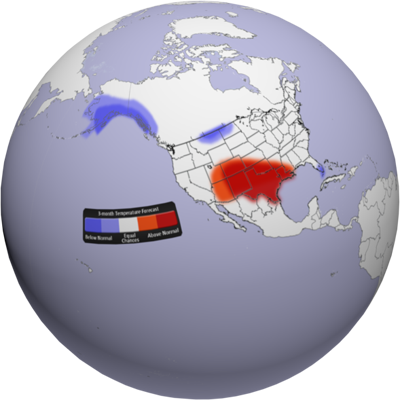 U.S. Climate Outlook – Temperature
- As La Niña kicks into full swing for this winter, the effects will be felt across the country. For the November-January period, warmer than normal temperatures are expected across the southern plains and into the four corners region of the southwest.
- By contrast, cooler than normal temperatures can be expected for Alaska, parts of Montana and North Dakota, as well as for the snow birds in south Florida.
- All other locations (in white) have equal chances of being warmer or cooler than normal. Major circulations and cycles (like La Niña) don’t play as much a role, making it more difficult to forecast.
- Forecast by NOAA’s Climate Prediction Center (CPC)
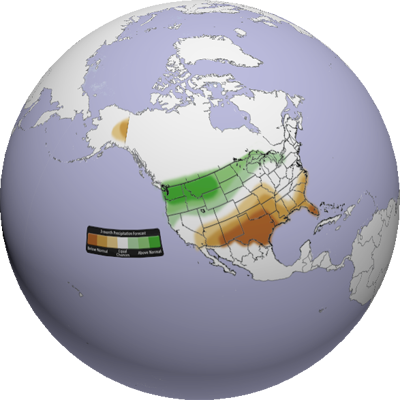 U.S. Climate Outlook – Precipitation
- For the next three months (Nov.-Jan.), drier than normal conditions will still prevail across the southern part of the country, especially Texas.
- Wetter than normal conditions, however, are expected across the northern states, especially in the northwest.
- All other locations (in white) have equal chances of being wetter or drier than normal. Major circulations and cycles (like La Niña) don’t play as much a role, making it more difficult to forecast.
- Forecast by NOAA’s Climate Prediction Center (CPC)
Helpful Resources for More Information
- http://www.ncdc.noaa.gov/teleconnections/enso/enso-tech.php
- http://www.ncdc.noaa.gov/oa/ncdc.html
- http://www.ncdc.noaa.gov/sotc/global/
- http://www.pmel.noaa.gov/tao/elnino/la-nina-story.html
- http://weather.gov/glossary/index.php?word=extratropical
- http://www.cpc.ncep.noaa.gov/
Where do I find the datasets?
- First, check your SOS system to make sure it’s not already in an EarthNow playlist. As this is a very new project, we are experimenting with how to provide the visualizations. It might already be there.
- If not, you can download the datasets and playlist.sos files from this FTP Site.
Well, that’s all for this time… any timely topics you want covered for next time?


