November 30th marked the end of the 2011 Atlantic hurricane season. We have compiled some data visualizations to help you convey to your guests the storm tracks, how what actually occurred compares to the predictions, and also some of the reasons why the storms did what they did.
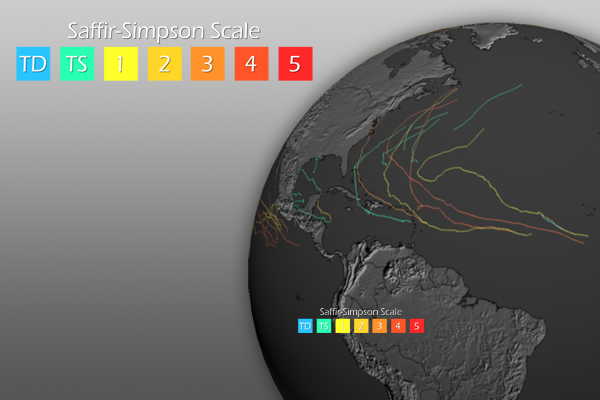
 2011 Tropical Cyclone Tracks
- While we’re focusing on the Atlantic season because it just wrapped up, this dataset shows all tropical cyclone activity for 2011.
- Pay attention to the storm intensity color bar and notice how the lines (tracks) change color.
- 19 Named Storms (Atlantic), Average: 11, Forecast: 12-19
- 7 Hurricanes (Atlantic), Average: 6, Forecast: 6-10
- 3 Major Hurricanes (Cat 3+, Atlantic), Average: 2, Forecast: 3-6
- Hurricane Irene was the only storm to make landfall in the U.S., making it the first hurricane to make U.S. landfall since 2008.
- NOAA also predicted Irene’s track very accurately more than 4 days out, showcasing improved track forecasting due to improved satellite and model data.
- Irene, however, was somewhat weaker than expected at landfall, hinting at the challenges of intensity forecasting.
For more information (straight from NOAA), CLICK HERE
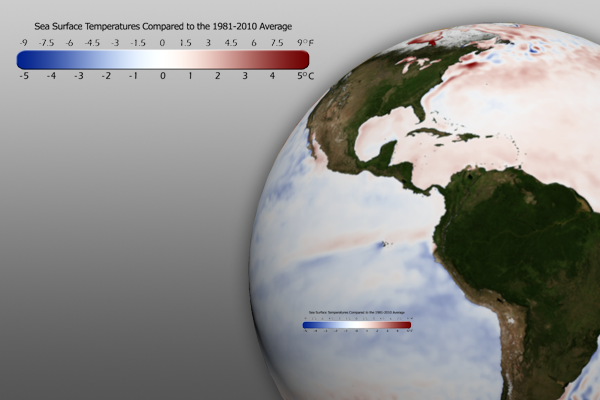
 Global Climate Drivers: Sea Surface Temperature
- The eastern central Pacific ocean had (and still has) cooler than normal sea surface temperatures for the August-October 2011 period, indicative of a La Niña event. (represented by the blue colors in the dataset).
- This can sometimes cause the Atlantic tropical activity to become more active, as it did this year between August and October.
- Further, the Atlantic SSTs were above normal for the 2011 season, which is favorable for tropical cyclone development.
For more information about the 2011 predictions, including La Niña impacts, CLICK HERE.
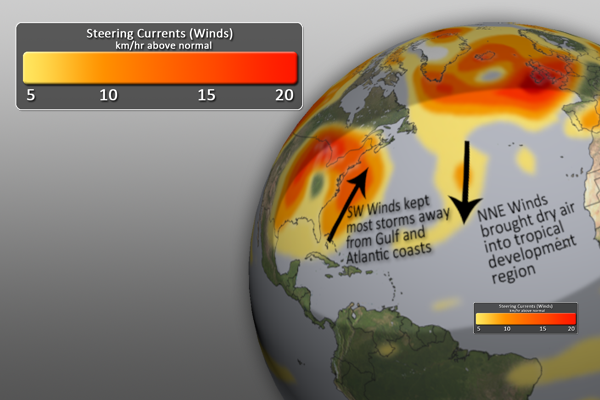
 Global Climate Drivers: Steering Currents and Winds
- While there were 19 named storms, relatively few became hurricanes and only one impacted U.S. coastlines.
- High pressure over the central North Atlantic brought drier air into the tropical development region, creating less favorable conditions for stronger tropical cyclone formation.
- Low pressure over the eastern half of the U.S. with stronger than normal (up to 15-20 km/hr above normal) winds “steered” many of the storms away from the Gulf of Mexico and Atlantic ocean coastlines.
- It should also be noted that several named storms were short-lived and may not have been detected before weather satellites or even with older satellite instruments.
Helpful Resources for More Information
- http://www.noaanews.noaa.gov/stories2011/20111128_endofhurricaneseason_2011.html
- http://www.cpc.ncep.noaa.gov/products/outlooks/hurricane.shtml
- http://www.pmel.noaa.gov/tao/elnino/la-nina-story.html
- http://www.ncdc.noaa.gov/teleconnections/enso/enso-tech.php
Where do I find the datasets?
- First, check your SOS system to make sure it’s not already in the EarthNow category. There should also be an ‘earthnow.sos’ playlist file (you’ll need to add that to your sosrc folder).
- If not, you can download the datasets and playlist.sos files from this FTP Site.
Well, that’s all for this time. The next update will be the November climate digest.


