Each month, around the middle of the month, we will provide information regarding the previous month’s climate, as well as the U.S. seasonal outlook for the coming months. Overall, preliminary data analysis suggests that December 2011 was the 10th warmest December on record. Major stories include La Niña, several tropical cyclones, and low concentrations of Arctic sea ice. More detailed information follows:
 December 2011 Event Highlights
- This dataset highlights some of the major December events from the National Climatic Data Center’s (NCDC) monthly global climate analysis. The events are noted below with more information.
- El Niño/Southern Oscillation: Cooler than average waters in the eastern central Pacific Ocean mean that La Niña conditions continue. Click here for more information about La Niña and how it may impact the outlook for the forthcoming Winter season.
- Alaska: December 2011 was the third warmest December on record (since 1918).
- United States: Blizzard conditions impacted the southern Rocky Mountains and Central Plains (Dec. 19-20).
- United Kingdom: The UK had its warmest December since 2006.
- Spain: December 2011 was Spain’s driest since 1988.
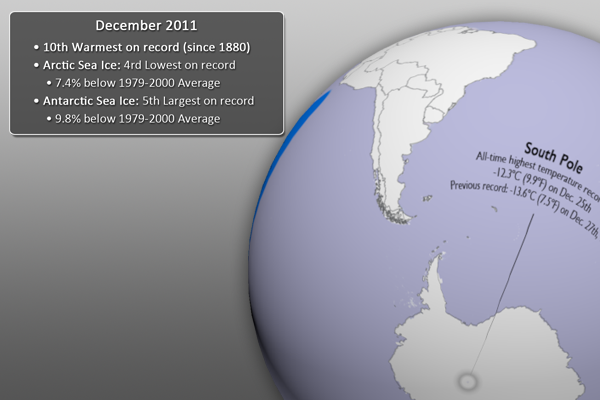
- South Pole: The South Pole recorded a new all-time high temperature of -12.3˚C (9.9˚F) on December 25th. The previous record was -13.6˚C (7.5˚F), set on December 27, 1978.
- Tropical Cyclone Thane: Tropical Cyclone Thane brought heavy rain and strong winds to the southeast India region, killing 42 people. The maximum winds were 150 km/hr (93 mph). (Dec. 25-31)
- Tropical Storm Washi: Tropical Storm Washi brought heavy rain to the southern Philippines, causing landslides and flooding. Nearly 1,300 people were killed. (Dec. 13-19)
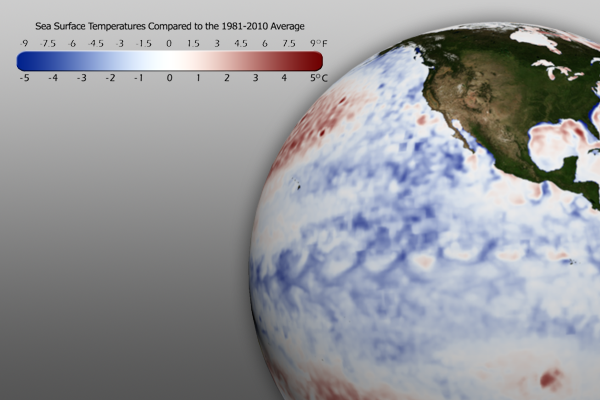 Sea Surface Temperature Anomaly
- The real-time sea surface temperature anomaly dataset is a great way to visualize the cooler than normal waters in the eastern central Pacific ocean. This indicates the La Niña pattern mentioned above.
- Remember that the blues indicate cooler than average temperatures and reds indicate warmer than average temperatures (white: average).
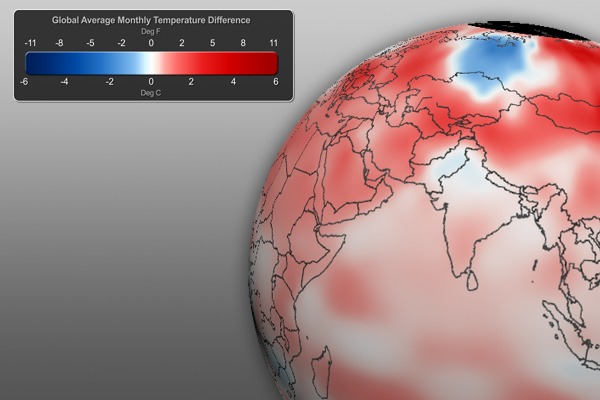
- Using the real-time Monthly Temperature Anomalies dataset is a great way to convey where some of the warmer and cooler than average areas were in November.
- The combined global land and ocean average surface temperature for December 2011 was the tenth warmest on record at 12.2˚C (54.0˚F), which is 0.48˚C (0.86˚F) above the 20th century average.
- The combined global land and ocean average surface temperature for the January – December period was 0.51˚C (0.92˚F) above the 20th century average, making it the 11th warmest such period on record.
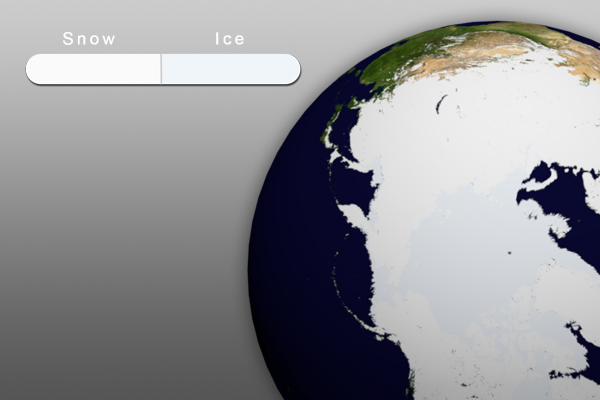
- Aside from helping to illustrate seasonal changes, the real-time Snow and Ice Cover dataset is a great way to convey sea ice change through time, including discussing how the current sea ice extent compares to other noteworthy years.
- The Arctic sea ice extent in December was the fourth lowest on record. The extent was 7.4% below the 1979-2000 average.
- In Antarctica, the December sea ice extent was the 5th largest on record, at 9.8% below the 1979-2000 average.
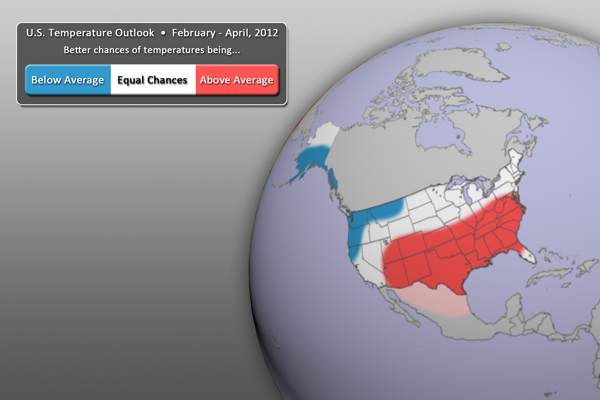 U.S. Climate Outlook – Temperature
- Weak to moderate La Niña conditions are expected to influence the U.S. temperature outlook (see below).
- For the February – April period, warmer than normal temperatures are expected across much of the southern half of the country, from the southwest plateau region eastward into the Mid Atlantic region.
- By contrast, cooler than normal temperatures can be expected for the southern half of Alaska, the Pacific Northwest and California, as well as Montana.
- All other locations (in white) have equal chances of being warmer or cooler than normal.
- Outlook by NOAA’s Climate Prediction Center (CPC)
- In its forecasts, the CPC uses a wide variety of models in conjunction with looking at climate variables (like La Niña).
- It should be noted that areas be in the “warmer than normal” region may still have bitterly cold winter days. This outlook only suggests that after the three months (February, March, and April) are over, those areas in the “warmer than normal” region are more likely to have experienced warmer than normal average temperatures. The same is true for the “cooler than normal” and “equal chances” regions.
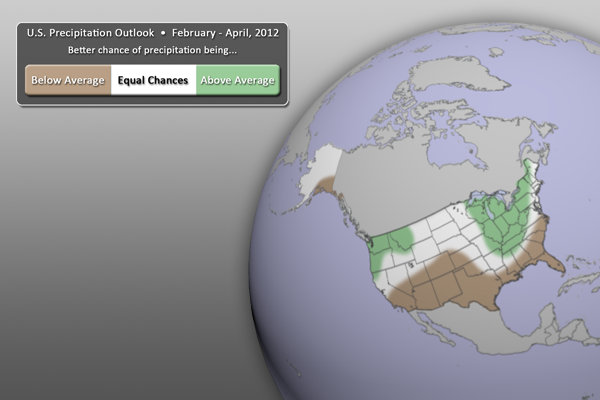 U.S. Climate Outlook – Precipitation
- For the next three months (February – April), drier than normal conditions are expected for much of the southern third of the country, as well as the southeast coastal states. The very southernmost parts of Alaska can also expect drier than normal conditions.
- Wetter than normal conditions, however, are expected across the Northwestern states, as well as the Great Lakes and Ohio/Tennessee River Valley States.
- All other locations (in white) have equal chances of being wetter or drier than normal.
- Outlook by NOAA’s Climate Prediction Center (CPC)
- In its forecasts, the CPC uses a wide variety of models in conjunction with looking at climate variables (like La Niña).
- It should be noted that areas be in the “drier than normal” region may still have rain and snow storms. This outlook only suggests that after the three months (February, March, and April) are over, those areas in the “drier than normal” region are more likely to have experienced drier than normal averages. The same is true for the “wetter than normal” and “equal chances” regions.
Helpful Resources for More Information
- http://www.ncdc.noaa.gov/oa/ncdc.html National Climatic Data Center (NCDC)
- http://www.ncdc.noaa.gov/teleconnections/enso/enso-tech.php About ENSO (El Niño/La Niña)
- http://www.ncdc.noaa.gov/sotc/global/ NCDC’s Global Climate Report
- http://www.pmel.noaa.gov/tao/elnino/la-nina-story.html About La Niña
- http://www.cpc.ncep.noaa.gov/ Climate Prediction Center (CPC)
Where do I find the datasets?
- First, check your SOS system to make sure it’s not already in the EarthNow category. There should also be an ‘earthnow.sos’ playlist file (you’ll need to add that to your sosrc folder).
- If not, you can download the datasets and playlist.sos files from this FTP Site.

