
Happy New Year, everyone!
For this EarthNow entry, we thought it would be nice to do a global Look Back at 2011, with regards to major weather and earth science events, as well as some important climate measurements. The bullet points below will simply tell you about how the dataset works. Below the bullet points, you will find more information regarding the events. For even more information, we have provided links for some of the events, as well. Enjoy!

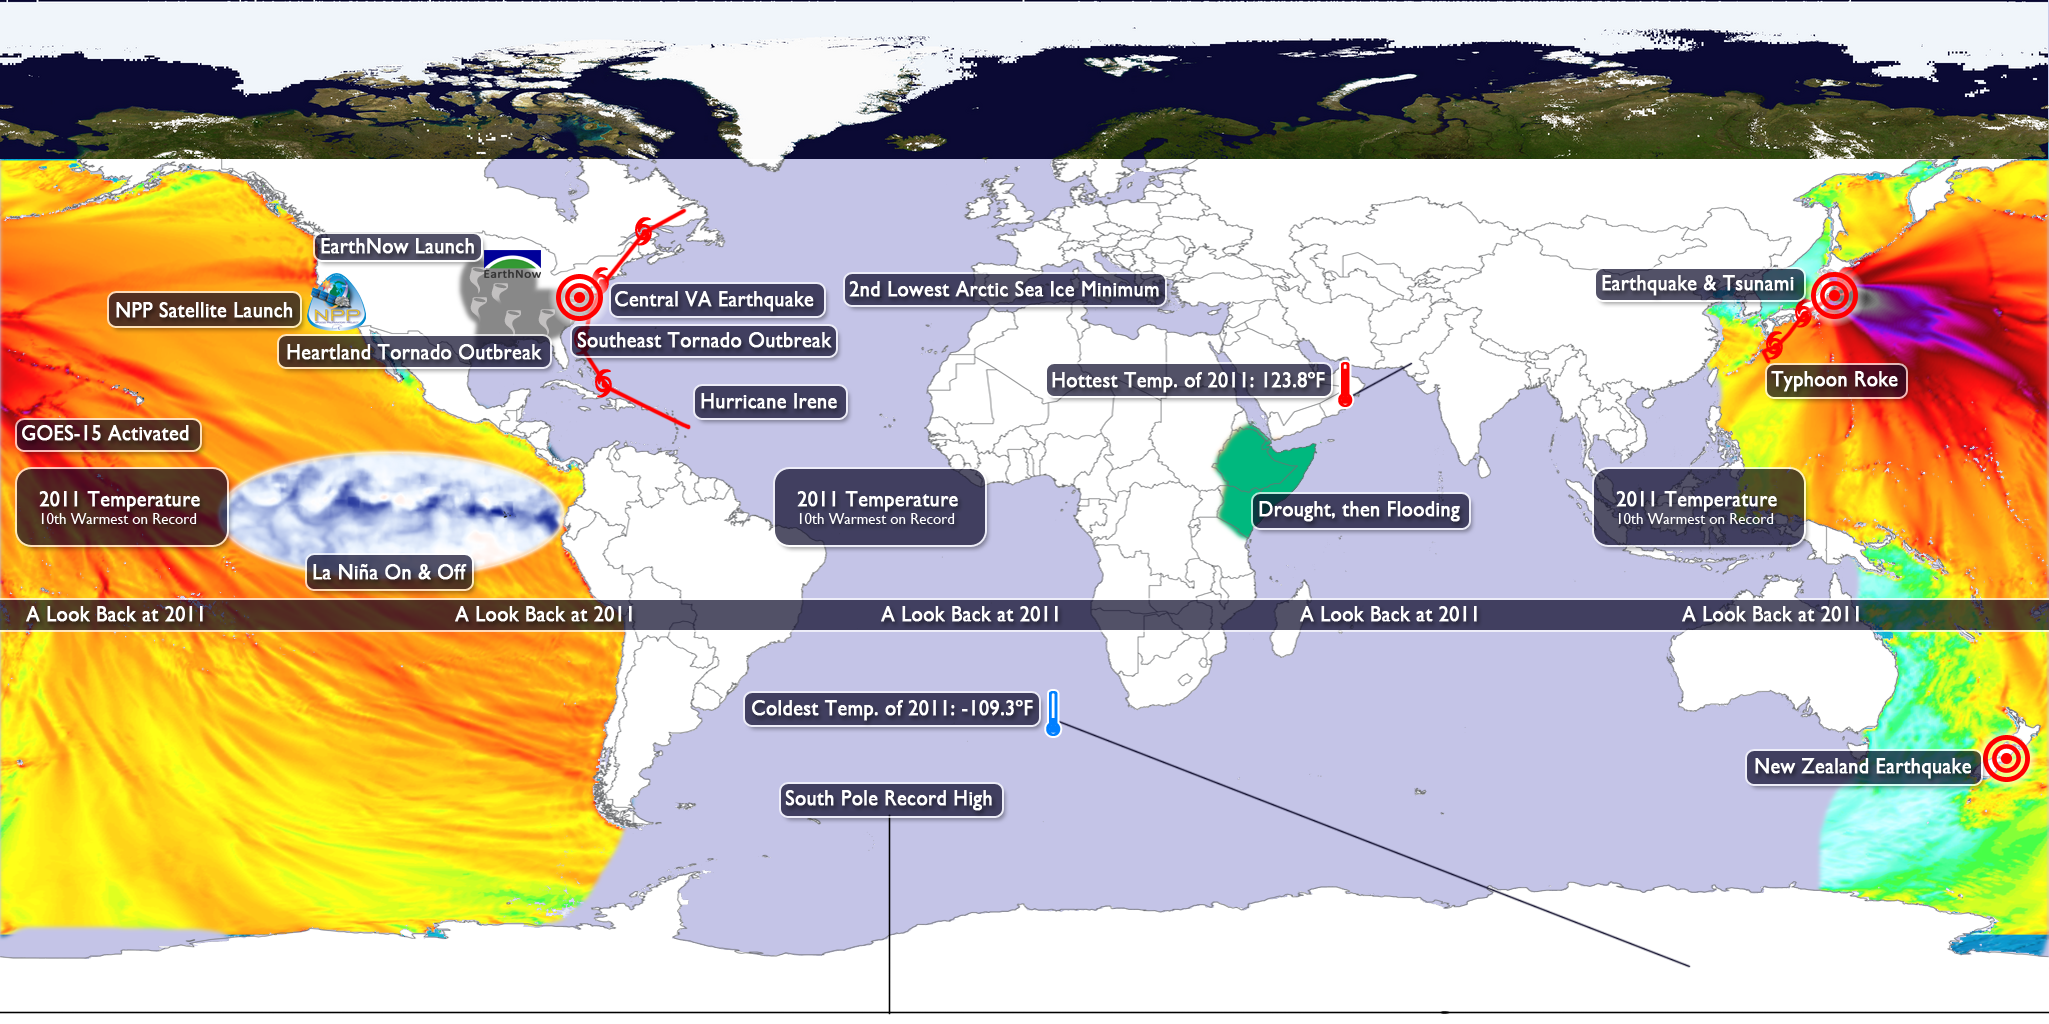
2011 Review • Animation not work? Click Here • Still Map Image
A 2011 Review
- This dataset contains a sequence of 14 frames, or images. The first frame is the “Title Frame.” The next 12 frames contain 1 frame for each month of 2011, with the 14th frame being a conclusion frame, highlighting all of the events of 2011.
- When you load the dataset, the animation will not start by default, allowing you to step through frame by frame using the remote. You can of course “Play” the animation, during which each frame will last for 20 seconds. These settings can be changed in the playlist setting for the file.
Monthly Highlights
January
- La Niña: In place for most of the year, with a brief hiatus during May – August [more information]
- Drought & Famine: Drought and related famine for much of the year in East Africa. [more information]
February
- La Niña Continues
- Drought & Famine Continue
- New Zealand Earthquake: February 22nd, 6.1. magnitude, near Christchurch, New Zealand [more information]
March
- La Niña Continues
- Drought & Famine Continue
- Japan Earthquake & Tsunami: March 11th, 9.0 magnitude [more information]
April
- La Niña Continues
- Drought & Famine Continue
- Southeastern U.S. Tornado Outbreaks: Throughout the month, 542 tornadoes, 369 fatalities [more information: part 1] [more information: part 2]
May
- La Niña transitions into a Neutral phase
- Drought & Famine Continue
- Midwest Tornado Outbreaks: Throughout the month, 355 tornadoes, 158 fatalities, mostly in Joplin, Missouri [more information: part 1] [more information: part 2]
- Coldest Temperature of 2011 Recorded: -109.3˚F (-78.5˚C), May 20th, Vostok Antarctic Research Station
June
- Drought & Famine Continue
- Hottest Temperature of 2011 Recorded: 123.8˚F (51.0˚C), June 8th, Nawabshah, Pakistan
July
- Drought & Famine Continue
August
- Drought & Famine Continue
- La Niña Returns
- Central Virginia Earthquake: August 23rd, 5.8 magnitude, very unusual [more information]
- Hurricane Irene: August 20-29, affected many populated areas along the U.S. East Coast [more information: part 1] [more information: part 2]
September
- La Niña Continues
- Drought & Famine Continue
- Arctic Sea Ice Minimum: September 9th, 2nd lowest minimum on record
- Typhoon Roke: September 9-21, East coast of Japan, along same areas affected by earthquake and tsunami, 13 fatalities [more information]
October
- La Niña Continues
- Flooding: Drought & Famine in East Africa give way to to heavy rain and flooding [more information]
- EarthNow: Officially launched in October [more information]
- NPP Satellite Launch: October 28th, Vandenberg Air Force Base, California, Providing enhanced Earth observations [more information]
November
- La Niña Continues
- Flooding in East Africa Continues
December
- La Niña Continues
- Flooding in East Africa wanes
- South Pole Record High Recorded: December 25th, 9.9˚F (-12.3˚C), Old Record: 7.7˚F (-13.6˚C) [more information]
- GOES-15 Activated: December 6th, Provides more data and higher resolution [more information]
Where do I find the datasets?
- First, check your SOS system to make sure it’s not already in the EarthNow category. There should also be an ‘earthnow.sos’ playlist file (you’ll need to add that to your sosrc folder).
- If not, you can download the datasets and playlist.sos files from this FTP Site.
That’s all for now. The next update will be the December Climate Digest.
Click for REFERENCES


