In mid-February, Tropical Cyclone Giovanna greatly impacted Madagascar, the fourth-largest island in the world, with high winds, storm surge, and heavy rain. After passing over the island one time, the storm turned around and made landfall again over the southern-most part of Madagascar, this time a much weakened storm. This EarthNow post will serve as a timeline of events to use in conjunction with the real-time satellite imagery datasets. We will also explore storm-related rainfall totals.
Tips on Using this Post within your SOS Presentation
- You could simply use the timeline information below with the existing real-time Infrared (IR) and/or Water Vapor (WV) datsets.
- As part of this post, there is also an IR playlist.sos file, which incorporates some PIP images, including higher resolution satellite images of Giovanna and even satellite imagery showing a sediment-clogged river after the storm. We have also included a storm-related rainfall totals PIP. This IR animation is focused on the dates of the storm.
- Further, we have included an IR playlist.sos file with red hurricane symbols placed at each of the mentioned locations in the timeline below. Please note that they will be visible throughout the entire IR animation, not just when Giovanna is visible. We are working hard to make this type of visualization more dynamic in the future! This IR animation is focused on the dates of the storm.
- But wait! There’s more… A third playlist.sos file includes both the Giovanna track symbols, as well as the PIPs mentioned in #2 above. This animation is also focused on the dates of the storm.
- So, to recap, you could simply use the information in the post along with the satellite datasets you already have in your playlist. Or, you could use one of the above-mentioned datasets to add more to the presentation. It’s all up to you! Let us know how you used the posts and playlist files.
Tropical Cyclone Giovanna Timeline of Events
9 February 2012, 1500 UTC (10:00 am EST, 6:00pm local time)
- Tropical Storm 12S
- Maximum Sustained Winds: 40 mph (65 km/hr)
- 794 miles (1,278 km) Northeast of La Reunion Island
- 14.1˚S, 65.1˚E, moving West at 10 mph (16.7 km/hr)
- Landfall in Eastern Madagascar expected on 13 February.
10 February 2012
- Tropical Cyclone Giovanna (remember, hurricanes are called tropical cyclones in the Indian ocean)
- Maximum Sustained Winds: 75 mph (120 km/hr), Category 1
- 552 miles (889 km) Northeast of La Reunion Island
- 15.8˚S, 61.2˚E, moving West-southwest at 9 mph (15 km/hr)
- Expected landfall in East-central Madagascar on 13 February
13 February 2012, 1500 UTC (10:00 am EST, 6:00 pm local time)
- Maximum Sustained Winds: 144 mph (232 km/hr), Category 4 (potentially catastrophic damage)
- 288 miles (463 km) East of Antananarivo, Madagascar (Capital City)
- 18.8˚S, 50.8˚E, moving West-southwest at 14 mph (22 km/hr)
- Expected landfall in East-central Madagascar near dawn
- Eastern Madagascar already experiencing gusty winds, rough surf, and rain
- Eye: 35 miles (56 km) wide
14 February 2012
- Tropical Cyclone Giovanna made landfall just north of the the city of Vatomandry on the east coast of Madagascar during the early morning hours with winds up to 120 mph (194 km/hr), heavy rain, strong winds, and storm surge.
- Vatomandry experienced a great deal of damage, with around 60% of the homes being damaged or destroyed, according to the BBC
- The storm continued to track Southwest across Madagascar.
- By afternoon (1200 UTC, 7:00am EST, 3:00pm local time), the storm had weakened considerably:
- Maximum Sustained Winds: 40 mph (165 km/hr)
- 115 miles (185 km) West of Antananarivo
- 19.6˚S, 44.7˚E, moving West at 16 mph (26 km/hr)
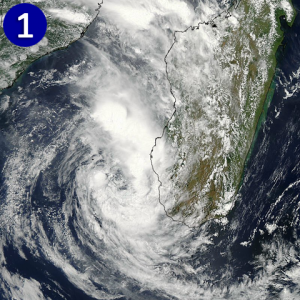
- PIP (SOS Picture In Picture) #1
- The MODIS instrument captured this true color image of Giovanna just after the center of circulation moved off the west coast of Madagascar and into the Mozambique Channel
15 February 2012, 0300 UTC (10:00 pm 2/14 EST, 6:00 am local time)
- Maximum Sustained Winds: 46 mph (74 km/hr), Tropical Storm
- 288 miles (463 km) West-southwest of Antananarivo
- 20.8˚S, 42.4˚E, moving West-southwest at 15 mph (24 km/hr)
- In Mozambique Channel, expected to make another landfall in Momzambique
- Wind shear hinders much restrengthening
- Maximum Sustained Winds: 58 mph (93 km/hr)
- 518 miles (833 km) East of Maputo, Mozambique
- 24.5˚S, 40.7˚E
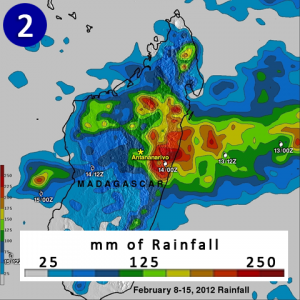
- Estimatesd of up to 12 inches (~305 mm) of rainfall in Eastern Madagascar
- Based on data from NASA’s TRMM Satellite (Tropical Rainfall Measuring Mission)
- PIP (SOS Picture In Picture) #2
- This NASA visualization shows the estimated rainfall from Giovanna between 8 February and 15 February.
17 February 2012, 1500 UTC (10:00 am EST, 6:00 pm local time)
- Maximum Sustained Winds: 63.3 mph (102 km/hr)
- 512 miles (824 km) SSW of Antananarivo
- 25.8˚S, 43.2˚E, moving Southeast at 2.3 mph (3.7 km/hr)
- Minor restrengthening expected before moving back over Southern Madagascar
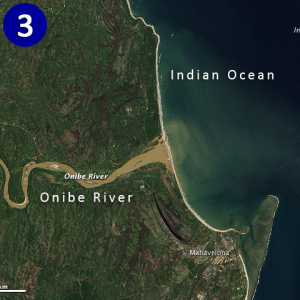
- PIP (SOS Picture In Picture) #3
- Advanced Land Image (ALI) on NASA’s Earth Observing Satellite (EO-1), captured this image of a sediment clogged Onibe River in eastern Madagascar. The heavy rain caused the area rivers (which already have a very steep gradient) to erode even more than normal, causing lots of sediment to move out into the Indian Ocean.
21 February 2012, 0300 UTC (10:00 pm 2/20 EST, 6:00 am local time)
- Maximum Sustained Winds: 34.5 mph (55.5 km/hr)
- 410 miles (670 km) Southeast of Antananarivo
- 23.4˚S, 52.6˚E, moving NNW at 8 mph (13 km/hr)
- After having moved over southern Madagascar, Giovanna continues final weakening in southern Indian Ocean
- at least 23 fatalities
- 190,000 people left homeless
That’s all for now. The next EarthNow post will the Monthly Climate Digest for February.
Where do I find the datasets?
- First, check your SOS system to make sure it’s not already in the EarthNow category. There should also be an ‘earthnow.sos’ playlist file (you’ll need to add that to your sosrc folder).
- If not, you can download the datasets and playlist.sos files from this FTP Site.


Pingback: COMING SOON! … February Climate Digest | EarthNow