Each month, around the middle of the month, we will provide information regarding the previous month’s climate, as well as the U.S. seasonal outlook for the coming months. Overall, preliminary data analysis suggests that February 2012 was the 22nd warmest February on record. Major stories include a warm contiguous United States, a weakening La Niña, and bitterly cold temperatures in Eurasia. More detailed information follows:
February 2012 Event Highlights
- This dataset highlights some of the major February events from the National Climatic Data Center’s (NCDC) monthly global climate analysis. The events are noted below with more information.
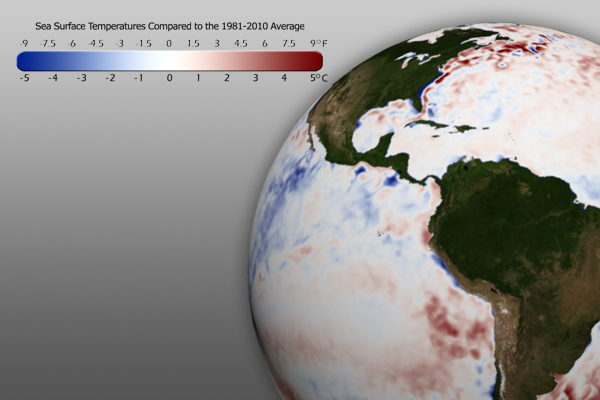
- El Niño/Southern Oscillation (ENSO): The cooler than average waters in the eastern central Pacific Ocean have continued to moderate, signaling a very weak La Niña. ENSO is expected to become “neutral” by May 2012. Click here for more information about La Niña and how it may impact the climate outlook for the coming months.
- Contiguous United States: Much of the country continued to experience very warm temperatures, resulting in the fourth warmest meteorological winter (December – February) on record (since 1895).
- Argentina: East-central Argentina experienced very heavy rains. Rainfall in the city of General Pico totaled 339.4 mm (~13 in), breaking the previous February record of 276.4 mm (10.8 in), set in 1984.
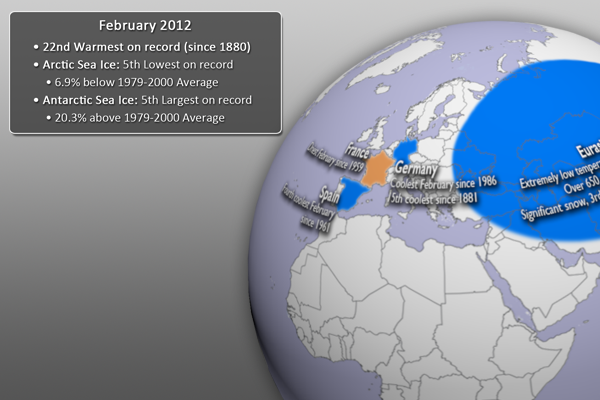
- Spain: Spain its fourth coolest February since 1961.
- France: France had its driest February since 1959.
- Germany: Germany experienced its coolest February since 1986 and the 15th coolest since records began (1881).
- Eurasia: Much of the Eurasian continent experienced very cold temperatures from January 24th through February 14th. More than 650 deaths are blamed on the bitterly cold temperatures. Heavy snow also fell, resulting in the third largest February snow cover extent.
- Cyclone Giovanna: (February 9-21, Max winds: 230 km/hr, 143 mph). Giovanna made landfall on the island of Madagascar on February 14th, bringing heavy rainfall, strong winds, and storm surge. The storm is blamed for 23 fatalities and leaving over 190,000 people homeless. For more information, see the last EarthNow blog post.
- Australia: Australia had its 8th coolest minimum (low) February temperatures (coolest since 1990).
Sea Surface Temperature Anomaly
- The real-time sea surface temperature anomaly dataset is a great way to visualize moderating water temperatures in the eastern central Pacific ocean. This indicates the weakening La Niña pattern mentioned above.
- Remember that the blues indicate cooler than average temperatures and reds indicate warmer than average temperatures (white: average).
Global Temperature Anomalies
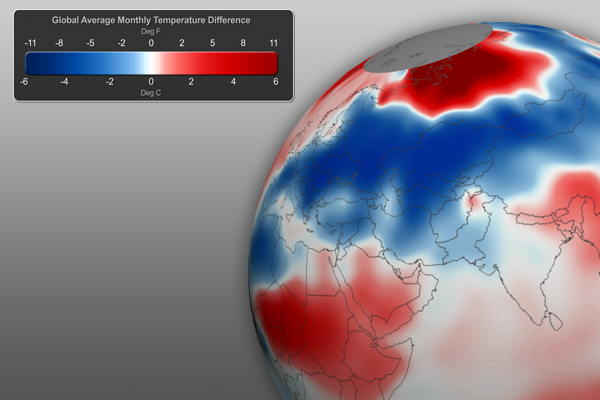
- Using the real-time Monthly Temperature Anomalies dataset is a great way to convey where some of the warmer and cooler than average areas were in February.
- The combined global land and ocean average surface temperature for February 2012 was the 22nd warmest on record (and coolest since 2008) at 12.47˚C (54.57˚F), which is 0.37˚C (0.67˚F) above the 20th century average.
Snow and Ice…
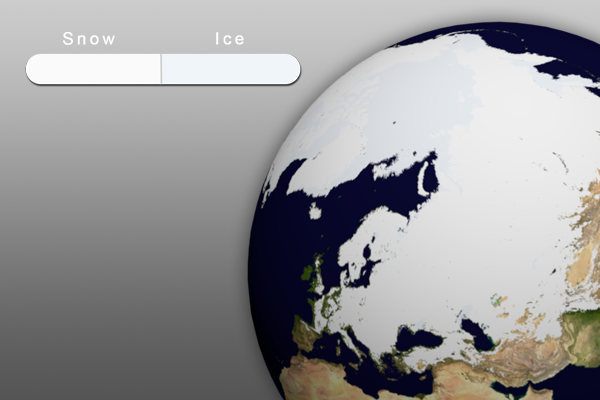
- Aside from helping to illustrate seasonal changes, the real-time Snow and Ice Cover dataset is a great way to convey sea ice change through time, including discussing how the current sea ice extent compares to other noteworthy years.
- The Arctic sea ice extent in February was the fifth lowest on record. The extent was 6.9% below the 1979-2000 average.
- In Antarctica, the January sea ice extent was the 5th largest on record, at 20.3% above the 1979-2000 average.
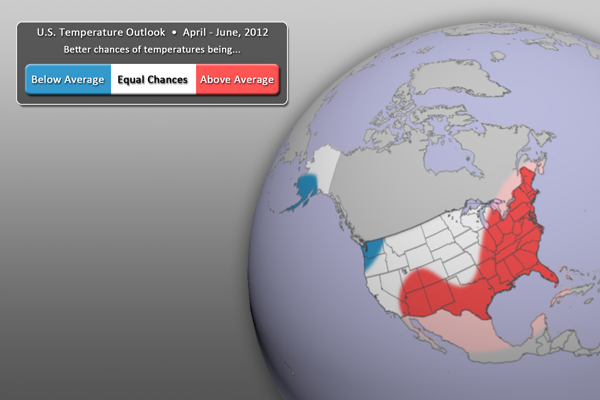
- Weakening La Niña conditions are expected to influence the U.S. temperature outlook (see below).
- For the April – June period, warmer than normal temperatures are expected across much of the eastern third of the country, as well as the southern third.
- By contrast, cooler than normal temperatures can be expected for the Pacific Northwest, north into southern Alaska.
- All other locations (in white) have equal chances of being warmer or cooler than normal.
- Outlook by NOAA’s Climate Prediction Center (CPC)
- In its forecasts, the CPC uses a wide variety of models in conjunction with looking at climate variables (like La Niña).
- It should be noted that areas in the “warmer than normal” region may still have cold winter days. This outlook only suggests that after the three months (April, May, and June) are over, those areas in the “warmer than normal” region are more likely to have experienced warmer than normal average temperatures. The same is true for the “cooler than normal” and “equal chances” regions.
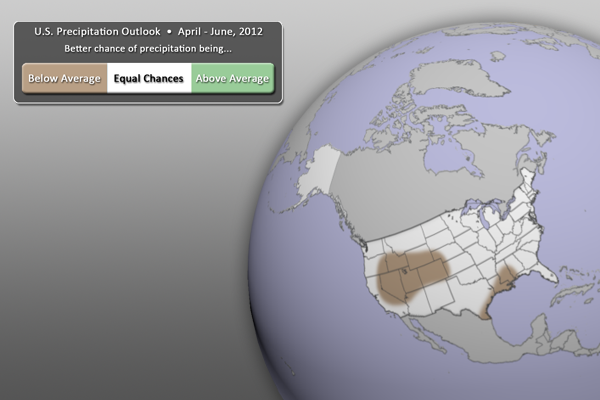
- For the next three months (April – June), drier than normal conditions are expected for parts of the western U.S. as well as along the western Gulf Coast.
- Wetter than normal conditions are next expected anywhere.
- All other locations (in white) have equal chances of being wetter or drier than normal.
- Outlook by NOAA’s Climate Prediction Center (CPC)
- In its forecasts, the CPC uses a wide variety of models in conjunction with looking at climate variables (like La Niña).
- It should be noted that areas be in the “drier than normal” region may still have rain and snow storms. This outlook only suggests that after the three months (April, May, and June) are over, those areas in the “drier than normal” region are more likely to have experienced drier than normal averages. The same is true for the “wetter than normal” and “equal chances” regions.
Helpful Resources for More Information
- http://www.ncdc.noaa.gov/oa/ncdc.html National Climatic Data Center (NCDC)
- http://www.ncdc.noaa.gov/teleconnections/enso/enso-tech.php About ENSO (El Niño/La Niña)
- http://www.ncdc.noaa.gov/sotc/global/ NCDC’s Global Climate Report
- http://www.pmel.noaa.gov/tao/elnino/la-nina-story.html About La Niña
- http://www.cpc.ncep.noaa.gov/ Climate Prediction Center (CPC)
- http://nsidc.org/arcticmet/patterns/arctic_oscillation.html About AO (Arctic Oscillation)
Where do I find the datasets?
- First, check your SOS system to make sure it’s not already in the EarthNow category. There should also be an ‘earthnow.sos’ playlist file (you’ll need to add that to your sosrc folder).
- If not, you can download the datasets and playlist.sos files from this FTP Site.

