

October 2012 Climate Digest • iPad Video
SOS Playlists
 SOS Playlist
Overview
Each month, we will provide information regarding the previous month’s climate. Overall, preliminary data analysis suggests that October 2012 was the fifth warmest on record (since 1880). Major stories include Superstorm Sandy, a warmer than normal Argentina, and a very dry Australia. More detailed information follows.

Sphere Preview • iPad Video
Highlights Dataset
Dataset Name: 20121120 EarthNow: October 2012 Highlights
 Full Map Image
- This dataset shows some of the major October weather and climate highlights from the National Climatic Data Center’s (NCDC) monthly global climate analysis, and serves as an overview of what can be discussed in the datasets that follow. Highlights are noted below with more information.
- Superstorm Sandy: October 22-29; Max. Winds: 176 km/hr; Heavy rain for Jaimaica, Haiti, the Dominican Republic, Cuba, and much of the eastern United States; Millions without power; blizzard conditions in the Appalachians; over 190 fatalities
- Argentina: Temperatures above average
- Australia: 10th driest October on 113-year record. Rainfall was only 48% of average.
- Central Africa: Heavy rain and flooding for Nigeria, Niger, Chad, and Cameroon.
- Republic of Moldova: Temperatures 4.5-6.3˚F above average
- Finland: Some areas received double the monthly average of precipitation.
- United Kingdom: Coldest October since 2003, 2.3˚F below 1981-2010 average
- Arctic Sea Ice: 24.6% below 1979-2000 average – 2nd smallest extent on record (behind 2007)
- Antarctic Sea Ice: 3.4% above 1979-2000 average – 3rd largest extent on record

Sphere Preview • No Animation
Sea Surface Temperature Anomalies Dataset
Dataset Name: 20121120 EarthNow: RT SST Anomalies
Full Map Image
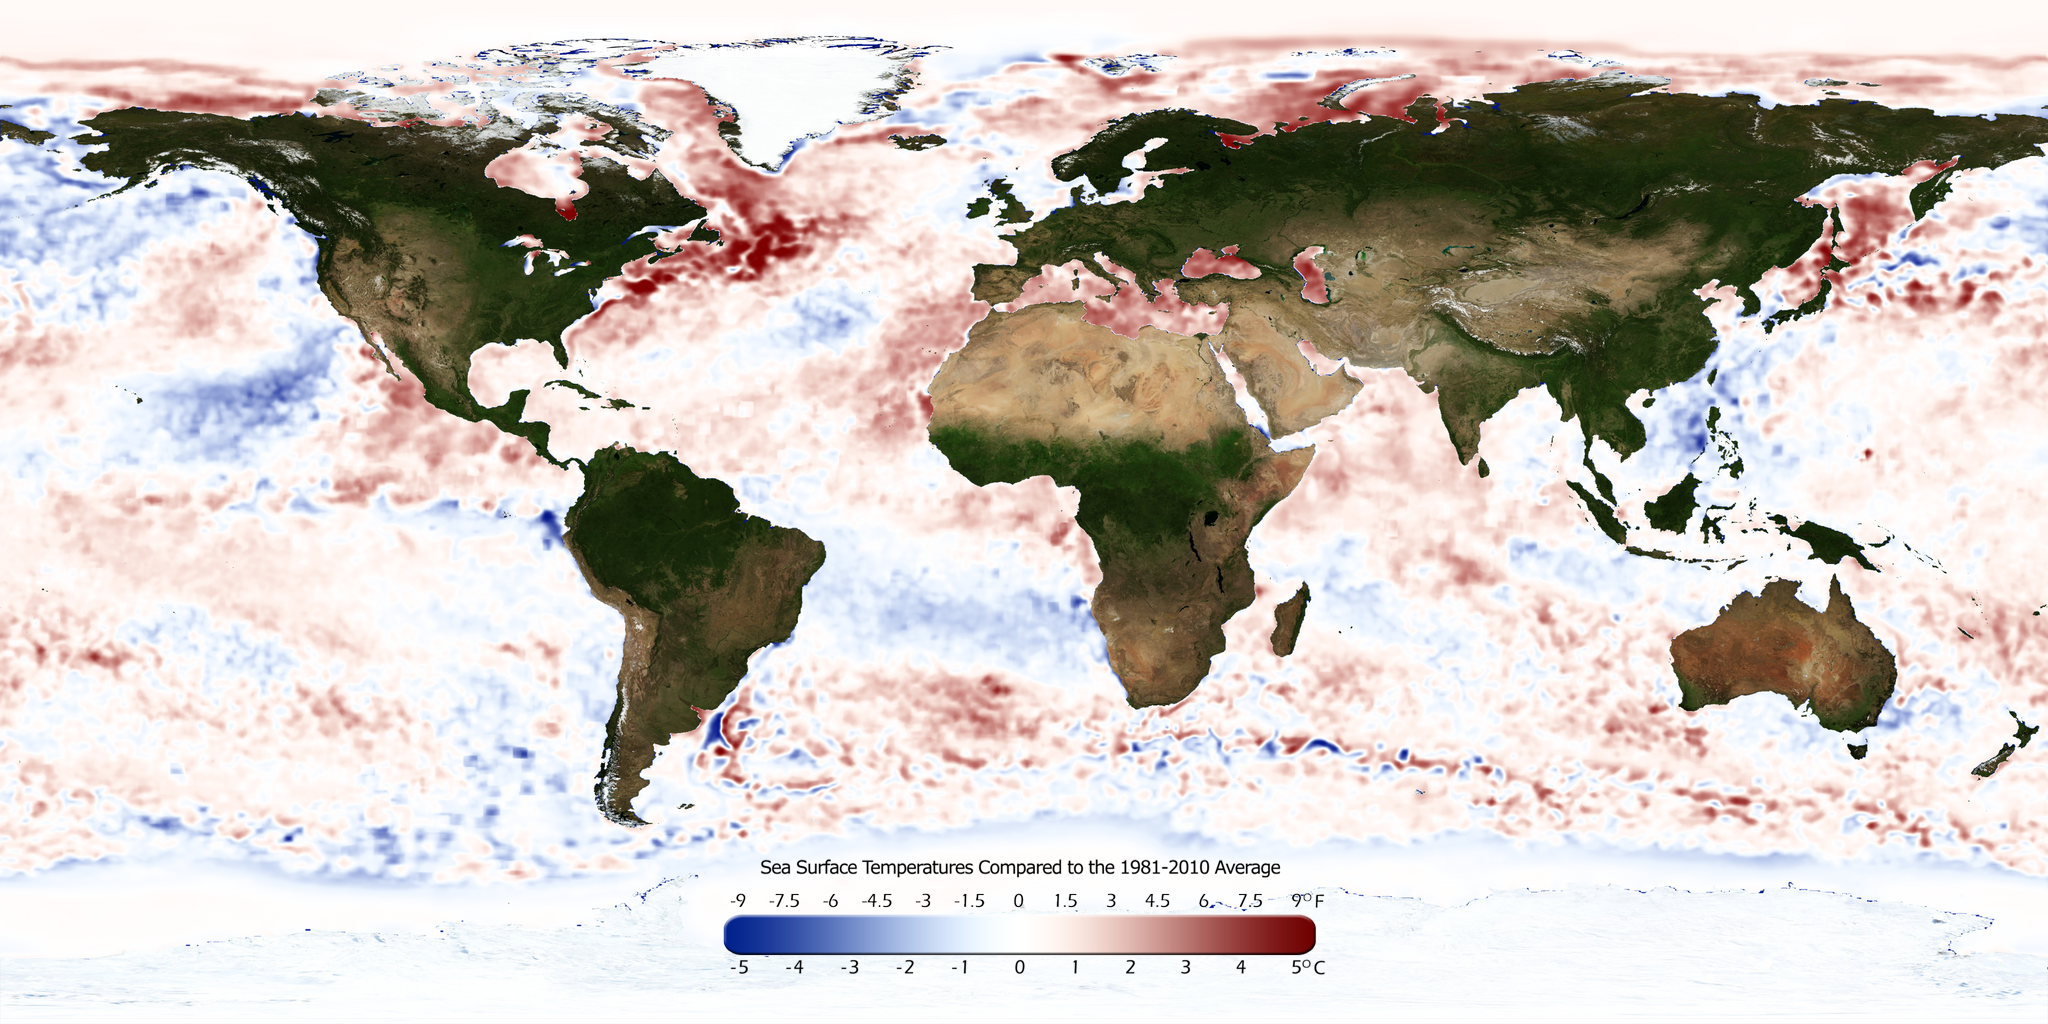
- The real-time sea surface temperature anomaly dataset is a great way to visualize the El Niño – Southern Oscillation (ENSO) cycle in the eastern tropical Pacific ocean. This helps show the moderate water waters, indicating an ENSO Neutral period.
- Remember that the blues indicate cooler than average temperatures and reds indicate warmer than average temperatures (white: average).

Sphere Preview • No Animation
Snow and Ice Cover Dataset
Dataset Name: 20121120 EarthNow: RT Snow and Ice Cover
Full Map Image
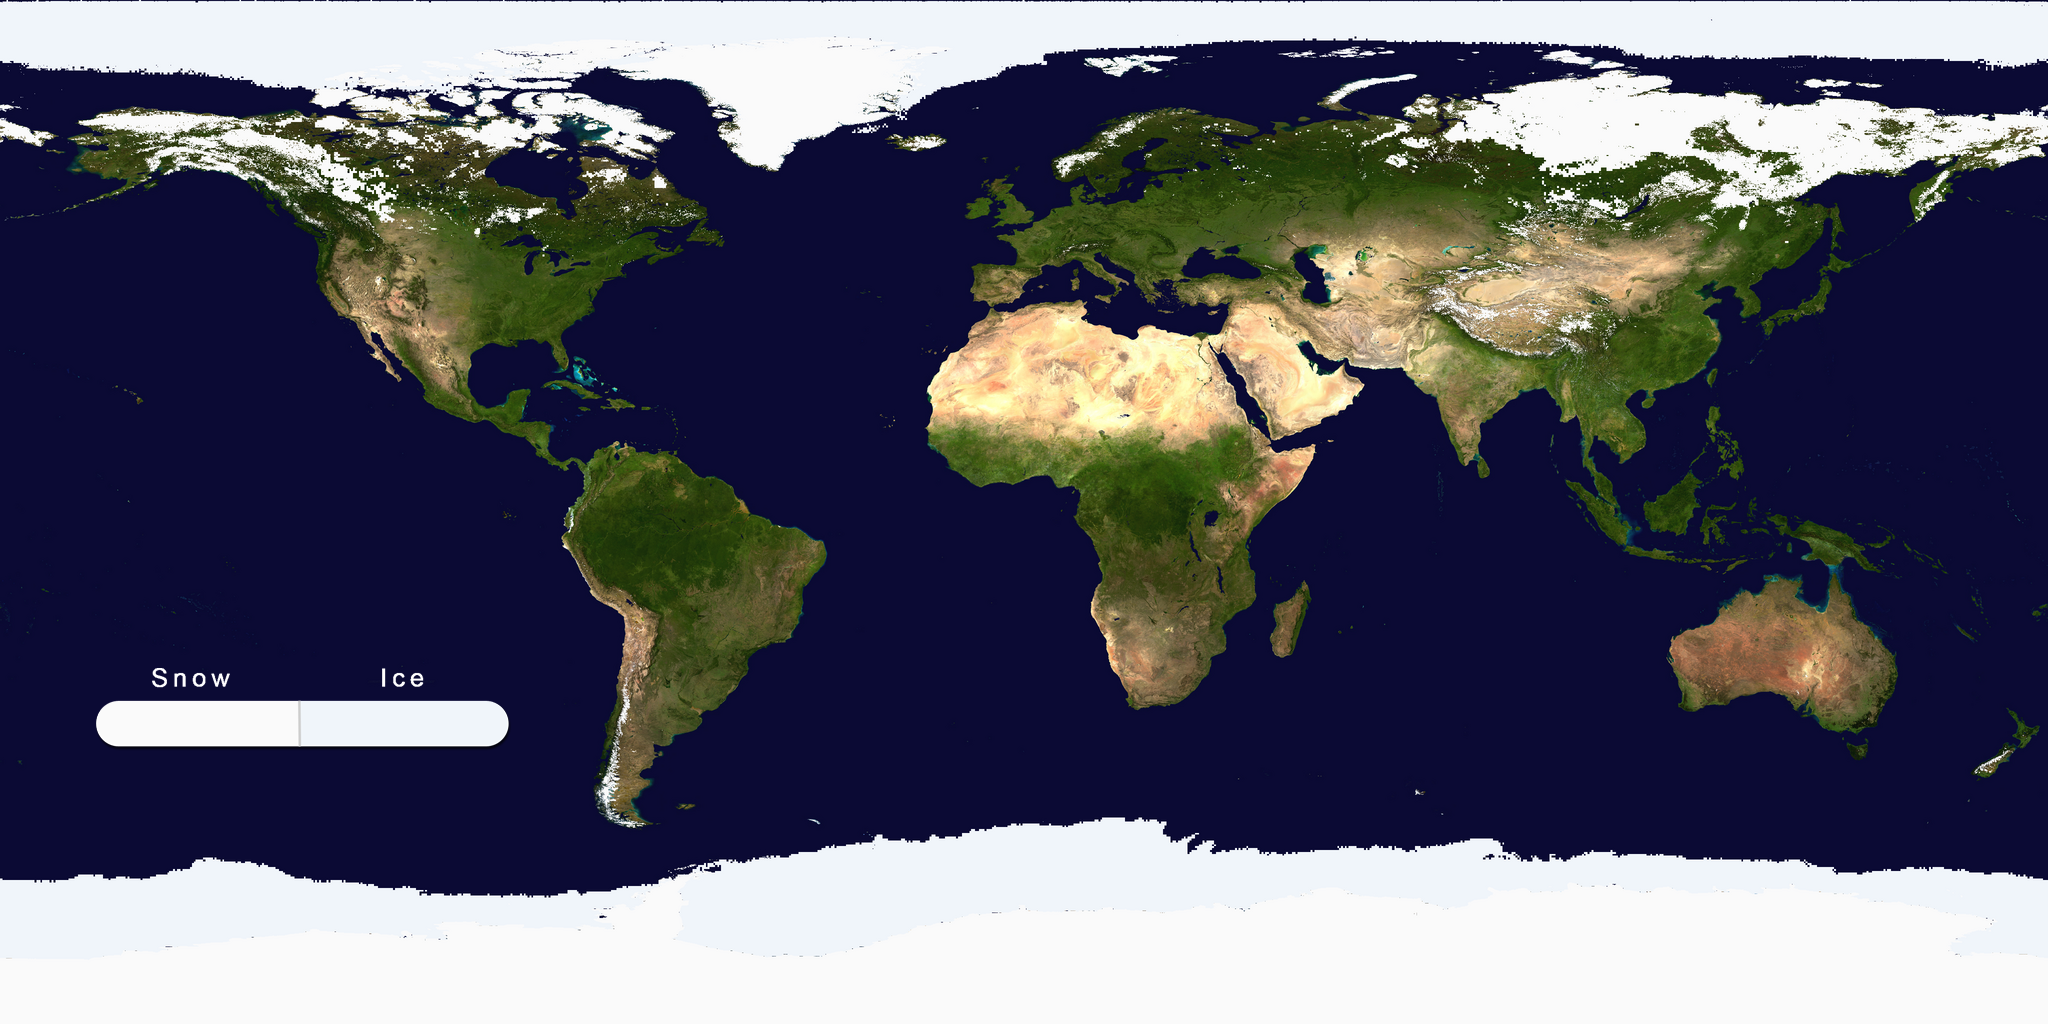
- Aside from helping to illustrate seasonal changes, the real-time Snow and Ice Cover dataset is a great way to convey sea ice change through time, including discussing how the current sea ice extent compares to other noteworthy years.
- The Arctic sea ice extent in October was the second smallest on record, behind 2007. The extent was 24.6% below the 1979-2000 average.
- In Antarctica, the sea ice extent was the third largest on record, at 3.4% above the 1979-2000 average.
Where do I find the datasets?
-
First, check your SOS system to make sure it’s not already in the EarthNow category.
-
If not, you can download the datasets and playlist files from this FTP Site.
-
Then download and use playlist files at the top of the page (or create your own) and make sure they are in /home/sos/sosrc or /home/sosdemo/sosrc.
Helpful Resources for More Information
-
http://www.ncdc.noaa.gov/oa/ncdc.html National Climatic Data Center (NCDC)
-
http://www.ncdc.noaa.gov/teleconnections/enso/enso-tech.php About ENSO (El Niño/La Niña)
-
http://www.ncdc.noaa.gov/sotc/global/ NCDC’s Global Climate Report


