
Overview
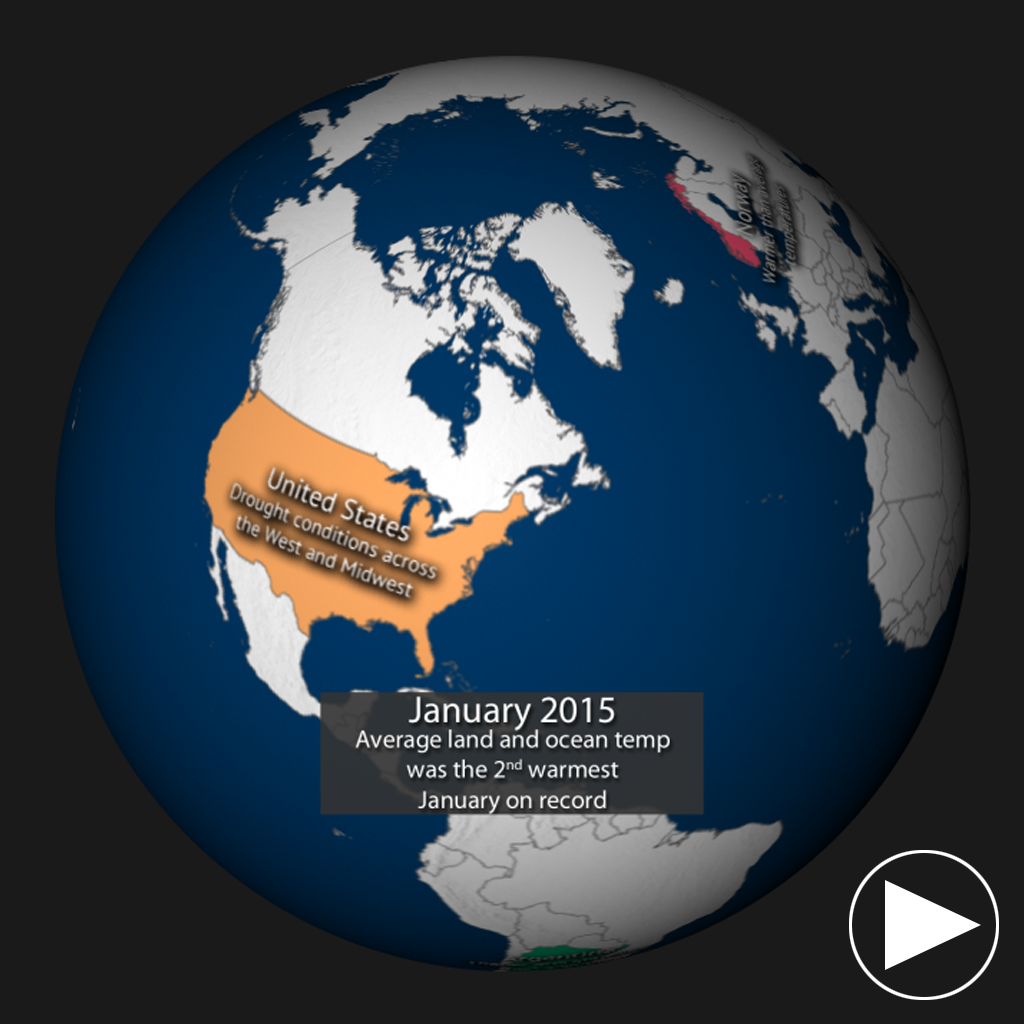
Each month, we will provide information regarding the previous month’s climate. January 2015’s average global land and ocean temperature was the second warmest January on record just behind 2007.
Highlights Dataset
Dataset: 20150221 EarthNow: January 2015 Highlights
Dataset: 20150221 EarthNow: AUDIO January 2015 Highlights
This dataset shows some of the major January weather and climate highlights from the National Climatic Data Center’s (NCDC) monthly global climate analysis, and serves as an overview of what can be discussed in the datasets that follow. Highlights are noted below.
- Australia: 134% average precipitation totals during the month. The Northern Territory, they experienced their sixth wettest January in the 116-year period of record.
- China: Warmest January since records began in 1961.
- Norway: Average monthly temperature was 2.6°C(4.7°F) above the 1961-1990 average. Some eastern locations of the country had departures 5-7°C(9-11°F) higher than the average.
- Argentina: Above precipitation in northern parts of the country. Some locations of the region received nearly double the monthly average precipitation totals.
- United States: Drought conditions worsened across the West and Midwest. The State of California experienced its fourth driest January on record and several cities in northern California also were record dry.
Sea Surface Temperature Anomalies Dataset
Dataset: 20150221 EarthNow: January 2015 SST Anomaly
Dataset: 20150221 EarthNow: AUDIO January 2015 SST Anomaly
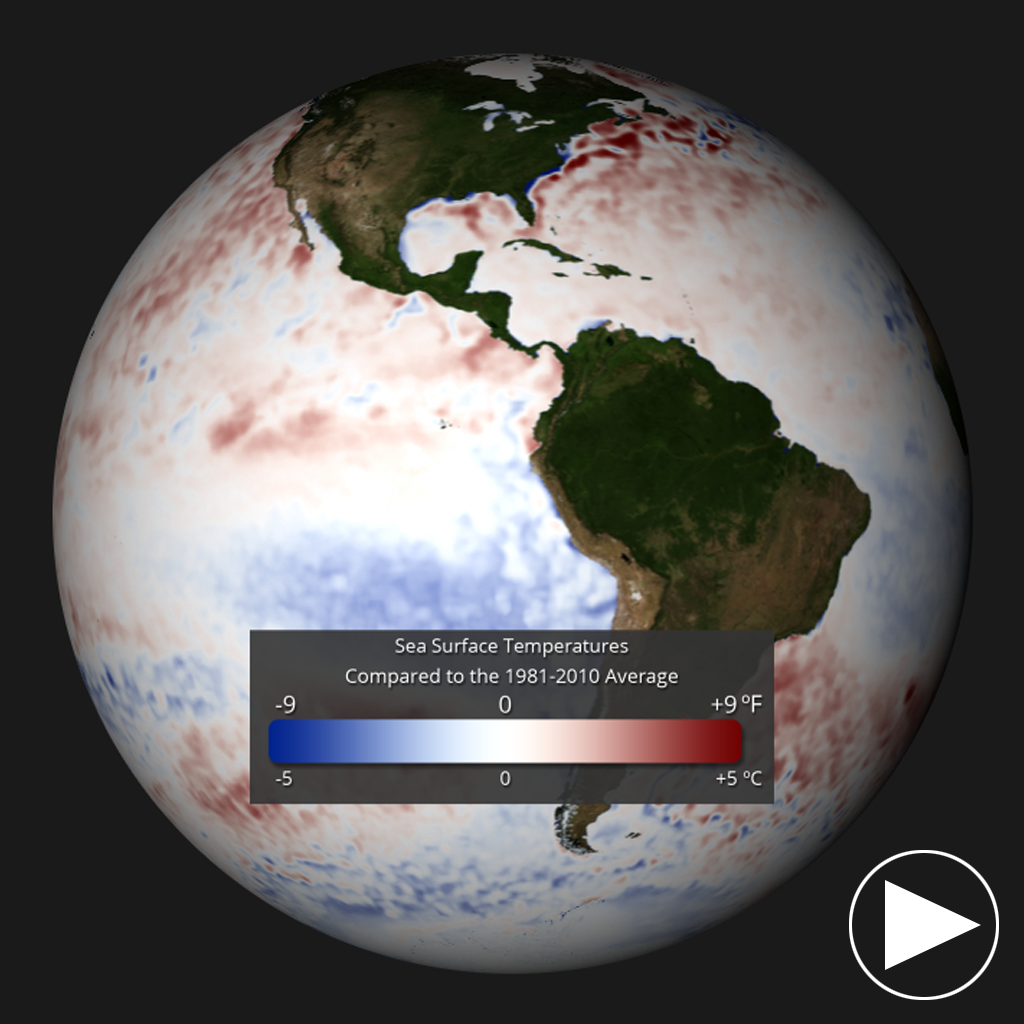
- The real-time sea surface temperature anomaly dataset is a great way to visualize the El Niño – Southern Oscillation (ENSO) in the eastern Pacific Ocean.
- The average January temperature for the global waters was the third highest for the month, at 0.53°C (0.95°F) above the 20th century average.
- As of early February 2015 there is about a 50-60% chance of a weak El Niño in the late Northern Hemisphere wither and early spring.
- Remember blues indicate cooler than average temperatures and reds indicate warmer than average temperatures (white: average).
Snow and Ice Cover Dataset
Dataset: 20150221 EarthNow: January 2015 Snow and Ice Cover
Dataset: 20150221 EarthNow: AUDIO January 2015 Snow and Ice Cover
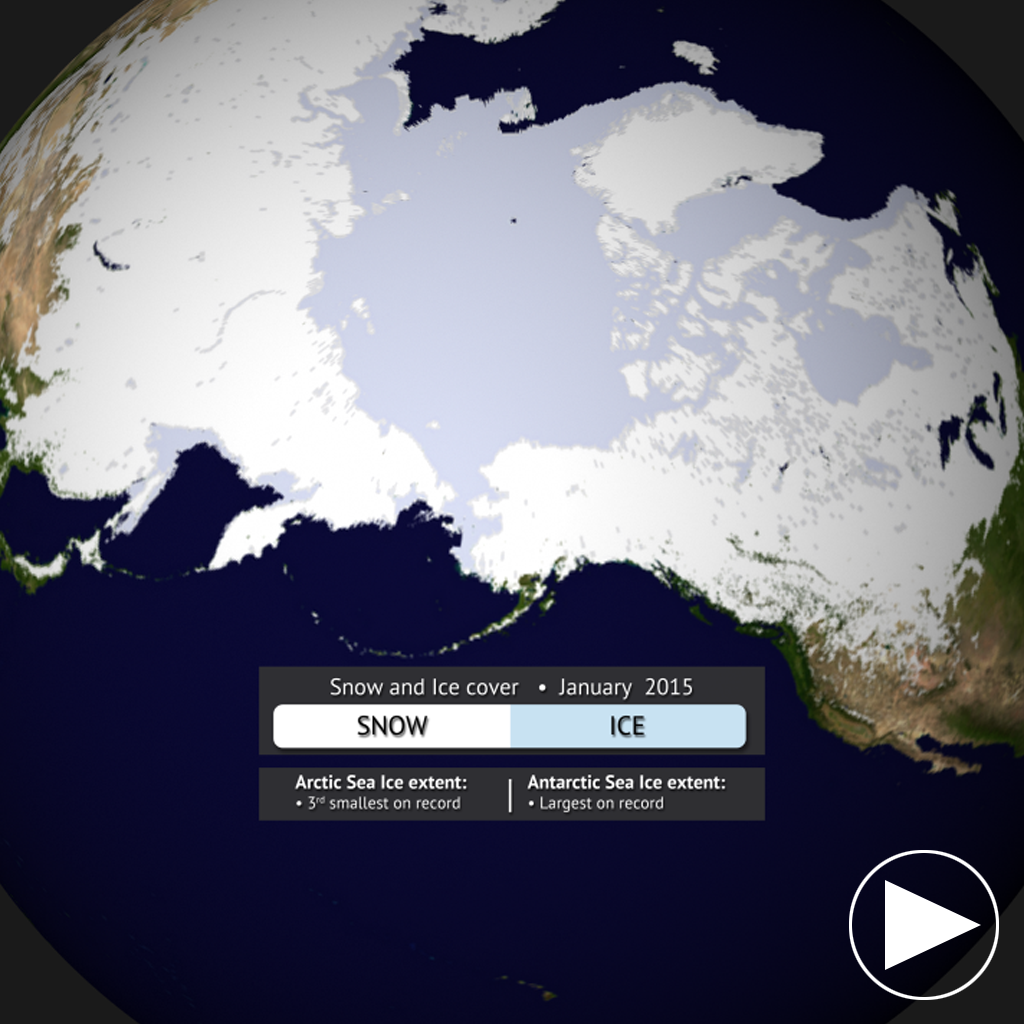
- Aside from helping to illustrate seasonal changes, the real-time Snow and Ice Cover dataset is a great way to convey sea ice change through time, including discussing how the current sea ice extent compares to other noteworthy years.
- The Arctic sea ice extent for January 2015 was 6.3% below the 1981-2010 average, making it the third smallest January sea ice extent since satellite records began in 1979.
- In Antarctica, the sea ice extent was 44.6% above the 1981-2010 average, the largest on record for the month of January.
Seasonal Outlooks
Be sure to check out the 3-month seasonal outlooks for March – May.
- Global Temperature Outlook
- Global Precipitation Outlook
- U.S. Drought Outlook
Where do I find the datasets?
-
First, check your SOS system to make sure it’s not already in the EarthNow category.
-
If not, you can download the datasets and playlist files from this FTP Site.
-
Then download and use playlist files at the top of the page (or create your own) and make sure they are in /home/sos/sosrc or /home/sosdemo/sosrc.
-
More detailed information here
Helpful Resources for More Information
-
http://go.wisc.edu/3nd6pg National Climatic Data Center (NCDC)
-
http://go.wisc.edu/9y2618 About ENSO (El Niño/La Niña)
-
http://go.wisc.edu/1nx2n3 NCDC’s Global Climate Report
Credits:
EarthNow Team
NOAA
References:
NOAA National Climatic Data Center, State of the Climate: Global Analysis for August 2014, published online September 2014, retrieved on September 29, 2014 from http://www.ncdc.noaa.gov/sotc/global/.


