
Overview
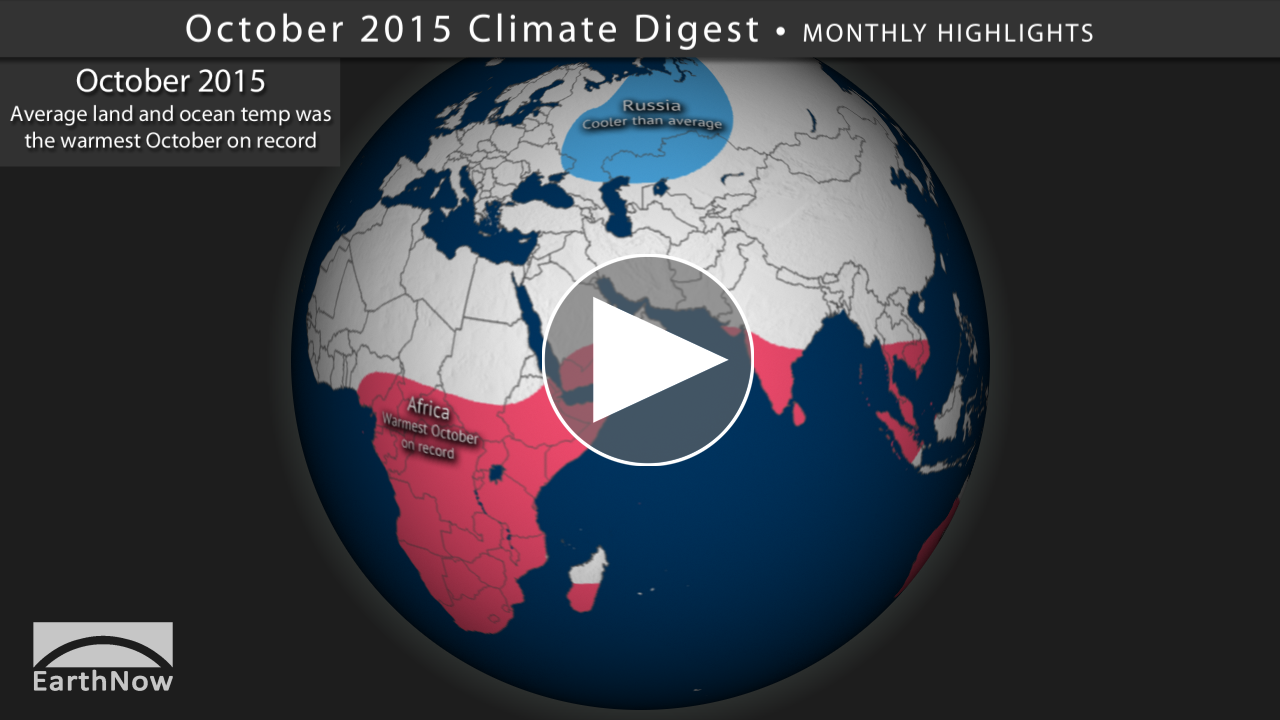
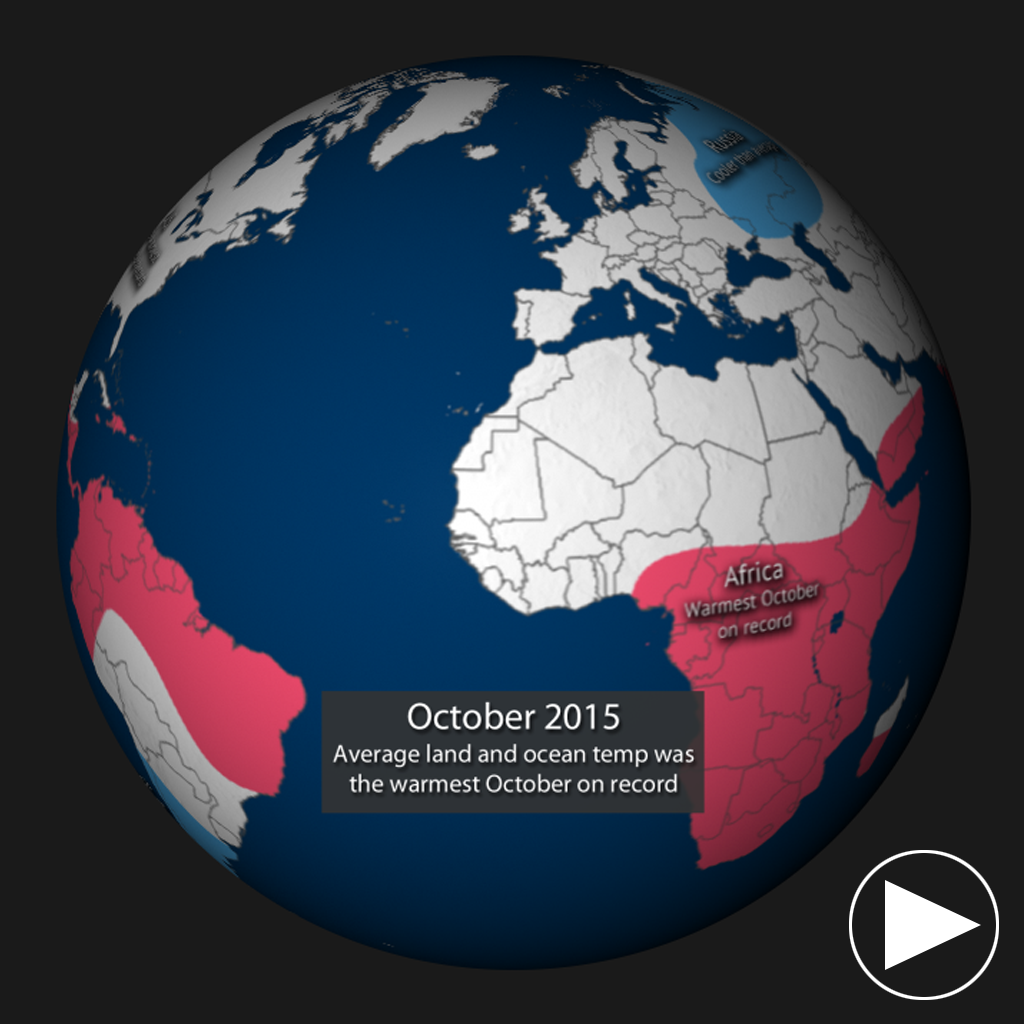
Each month, we will provide information regarding the previous month’s climate. October 2015 was the warmest October on record with a combined average global land and ocean temperature of 1.76°F, or 0.98°C, above the 20th century average. This marked the sixth consecutive month that the monthly global temperature record has been broken.
Highlights Dataset
Dataset: 20151121 EarthNow: October 2015 Highlights
Dataset: 20151121 EarthNow: AUDIO October 2015 Highlights
This dataset shows some of the major October weather and climate highlights from the National Climatic Data Center’s (NCDC) monthly global climate analysis, and serves as an overview of what can be discussed in the datasets that follow. Highlights are noted below.
- Australia: Warmest October on record.
- Africa: Warmest October on record.
- Russia: Cooler than average temperatures.
- South America: Cooler than normal temperatures, with several locations within Argentina experiencing record-breaking low temperatures.
- United States: 4th warmest October on record with an average temperature of 57.4°F or 3.3° above the 20th century average. Rainfall was also above average for the contiguous United States with a series of storms, including the remnants of Hurricane Patricia, brought record rain and flooding to the Southern Plains and Lower Mississippi Valley.
Sea Surface Temperature Anomalies Dataset
Dataset: 20151121 EarthNow: October 2015 SST Anomaly
Dataset: 20151121 EarthNow: AUDIO October 2015 SST Anomaly
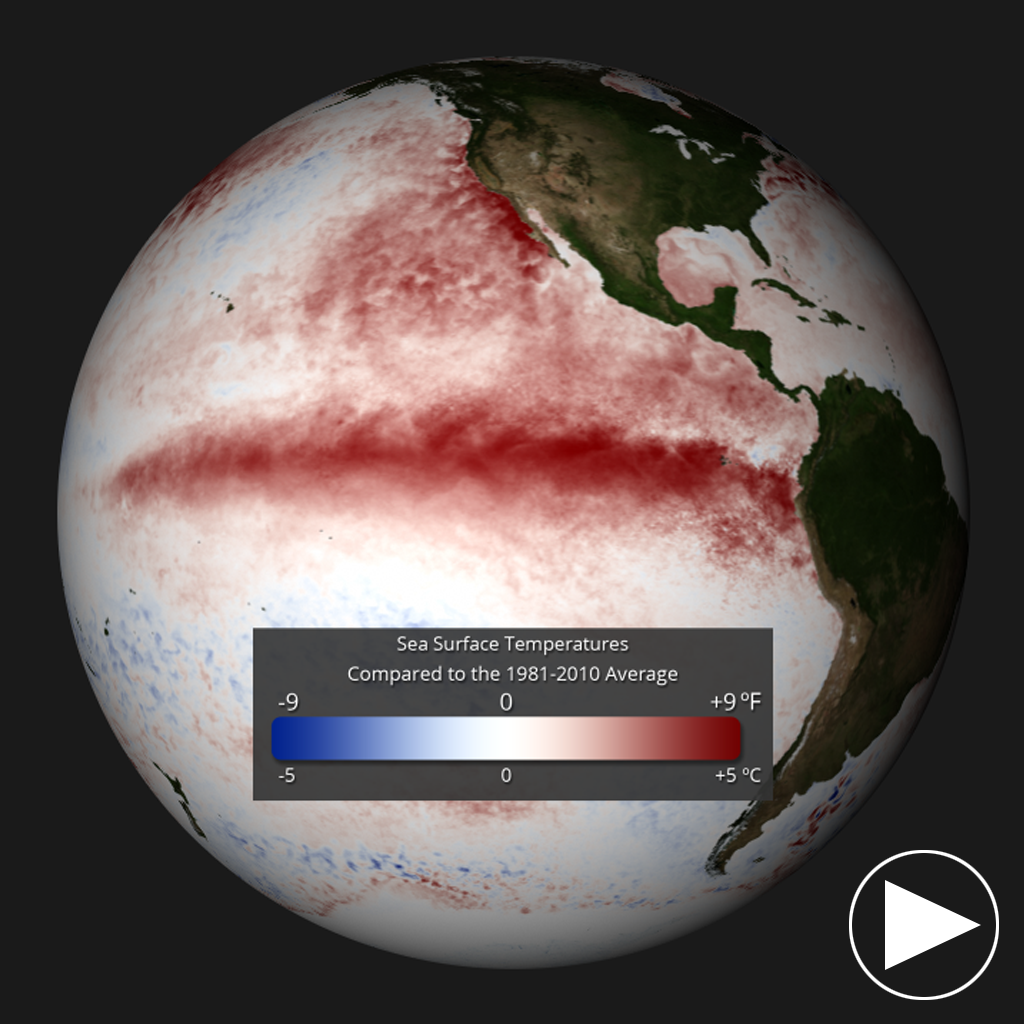
- The real-time sea surface temperature anomaly dataset is a great way to visualize the El Niño – Southern Oscillation (ENSO) in the eastern Pacific Ocean.
- The global sea surface temperature for October 2015 was 1.53°F or 0.85°C, above the 20th century average. This resulted in the highest departure on record for the month of October.
- According to NOAA’s Climate Prediction Center, current strong El Niño conditions are expected to peak during the Northern Hemisphere winter before weakening during spring 2016.
- Remember blues indicate cooler than average temperatures and reds indicate warmer than average temperatures (white: average).
Snow and Ice Cover Dataset
Dataset: 20151121 EarthNow: October 2015 Snow and Ice Cover
Dataset: 20151121 EarthNow: AUDIO October 2015 Snow and Ice Cover
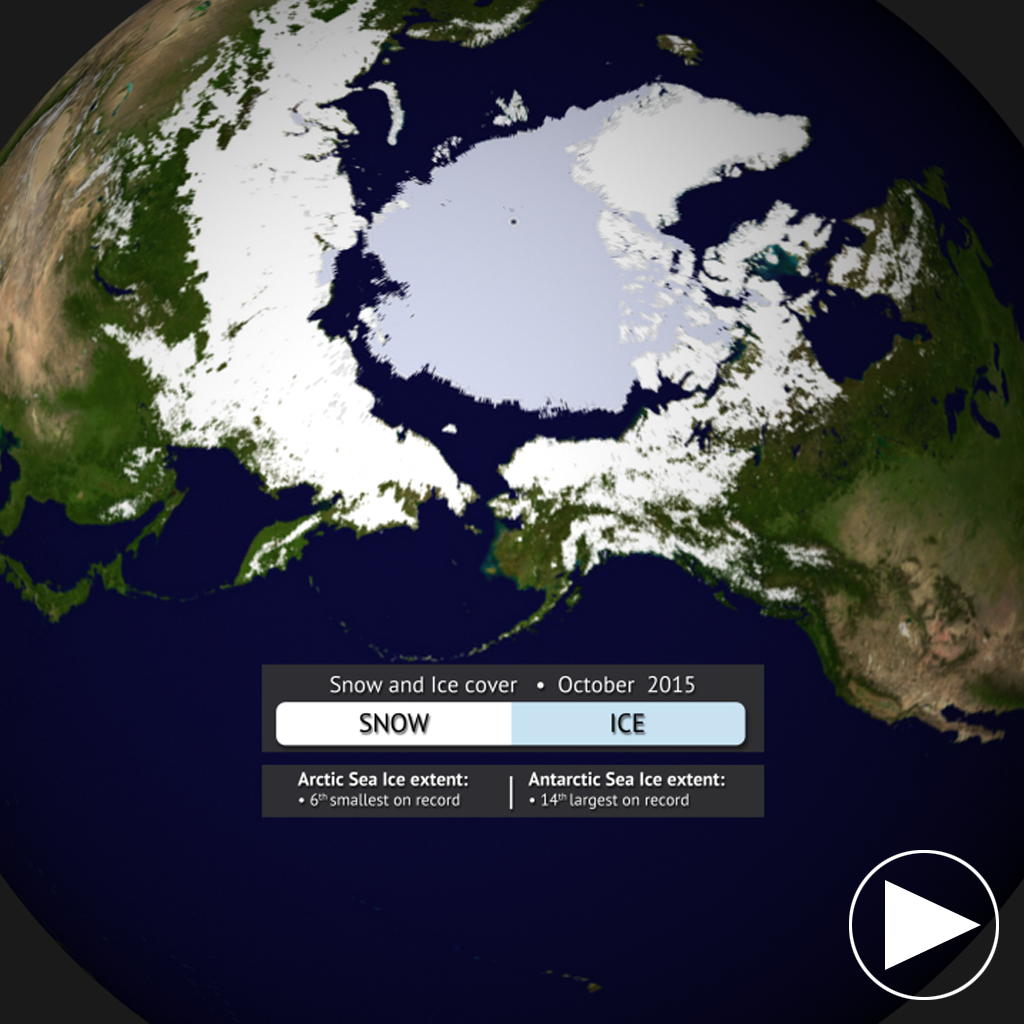
- Aside from helping to illustrate seasonal changes, the real-time Snow and Ice Cover dataset is a great way to convey sea ice change through time, including discussing how the current sea ice extent compares to other noteworthy years.
- The Arctic sea ice extent for August 2015 was 13.4% below the 1981-2010 average, making it the 6th smallest October sea ice extent since satellite records began in 1979.
- In Antarctica, the sea ice extent was 1.2% above the 1981-2010 average, the 14th largest on record for the month of September.
Seasonal Outlooks
Be sure to check out the 3-month seasonal outlooks for November-January.
- Global Temperature Outlook
- Global Precipitation Outlook
- U.S. Drought Outlook
Where do I find the datasets?
-
First, check your SOS system to make sure it’s not already in the EarthNow category.
-
In addition to the normal files, there is now a “digest” section. This section in the file structure has all of the normal files compiled into one video.
-
If not, you can download the datasets and playlist files from this FTP Site.
-
Then download and use playlist files at the top of the page (or create your own) and make sure they are in /home/sos/sosrc or /home/sosdemo/sosrc.
-
More detailed information here
Helpful Resources for More Information
-
http://go.wisc.edu/3nd6pg National Centers for Environmental Information (NCEI)
-
http://go.wisc.edu/9y2618 About ENSO (El Niño/La Niña)
-
http://go.wisc.edu/1nx2n3 NCDC’s Global Climate Report
Credits:
EarthNow Team
NOAA
References:
NOAA National Climatic Data Center, State of the Climate: Global Analysis for October 2015, published online November 2015, retrieved on November 21, 2015 from http://www.ncdc.noaa.gov/sotc/global/.


