November Climate Digest

climatedigest

Overview

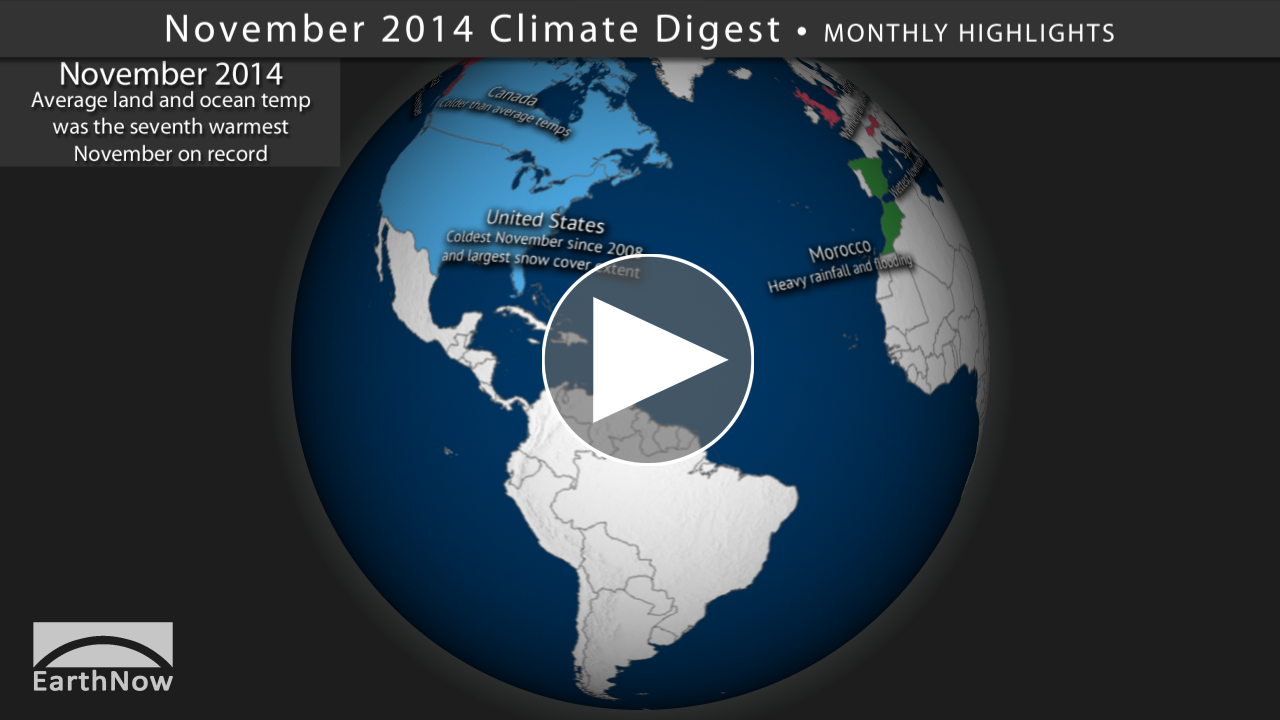
Each month, we will provide information regarding the previous month’s climate. November 2014’s average global land and ocean temperature tied with 2008 as the seventh warmest November on record.

Highlights Dataset

Dataset: 20141221 EarthNow: November 2014 Highlights

Dataset: 20141221 EarthNow: AUDIO November 2014 Highlights


This dataset shows some of the major November weather and climate highlights from the National Climatic Data Center’s (NCDC) monthly global climate analysis, and serves as an overview of what can be discussed in the datasets that follow. Highlights are noted below.


  • Europe: Multiple Countries experienced a top five warmest November. Austria and Switzerland had their warmest November yet: while Denmark had its 3rd warmest November and the United Kingdom had its 5th.
  • Spain: Reported its wettest November since 1997.
  • Morocco: Heavy rainfall during the 21st.-24th. of November. Severe flooding in southern Morocco.
  • United States: The contiguous U.S. had its coldest November since 2000 and its 16th coldest since records began in 1895. Lake-effect snow around Buffalo N.Y. accumulated to 127 cm or 4 ft. of snow within a 24-hr period. Some locations experienced as much as 170 cm or 5.5 ft. during the entire snowstorm.
  • Canada: Large accumulation of snow cover marked as the second largest snow extent for the month of November, just behind 2013. Contributing to the large snow cover was the colder than average temperatures during the month..
  • Alaska: 5th. warmest November was experienced since records began in 1918.
  • Australia: Warmest November on record.
  • South Africa: Above-average rainfall fell upon parts of the country. Some locations in the country received up to twice the monthly precipitation average totals.

Sea Surface Temperature Anomalies Dataset

Dataset: 20141221 EarthNow: November 2014 SST Anomaly

Dataset: 20141221 EarthNow: AUDIO November SST Anomaly


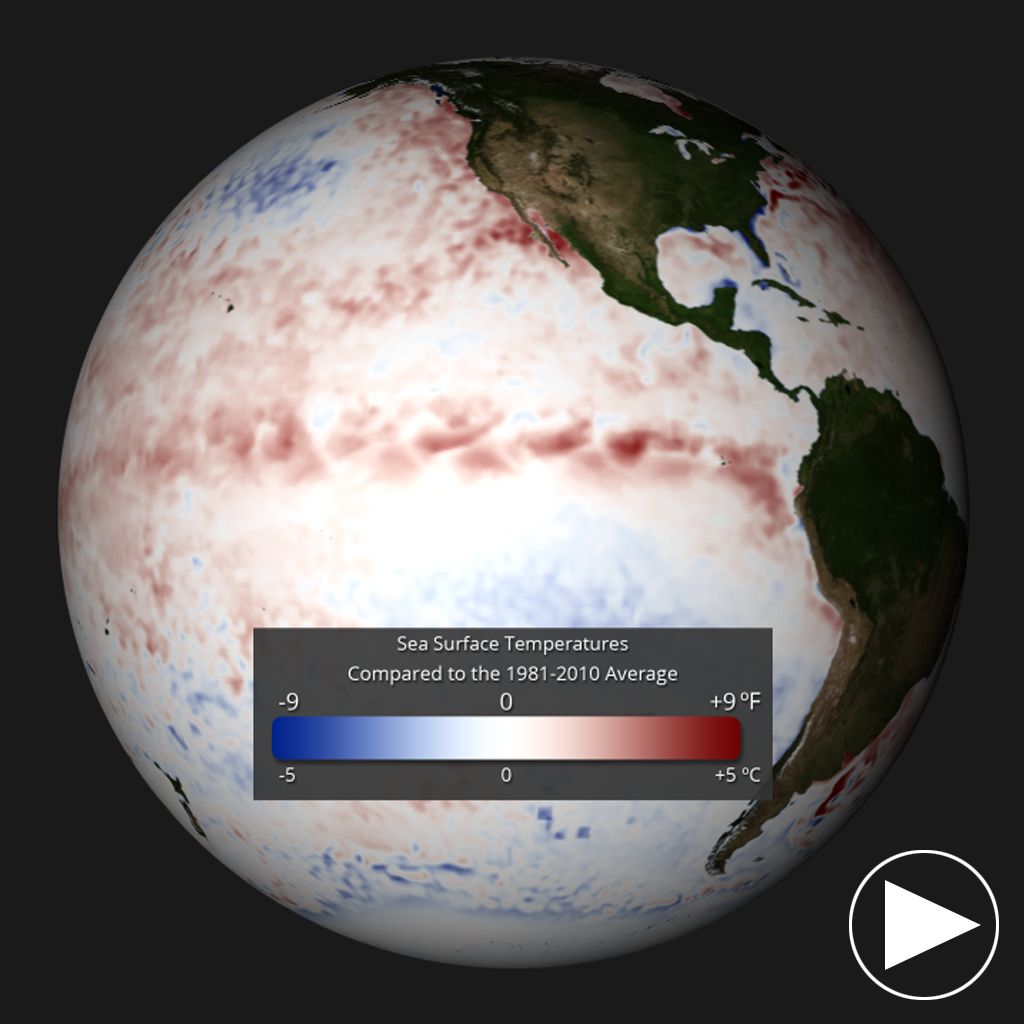
  • The real-time sea surface temperature anomaly dataset is a great way to visualize the El Niño – Southern Oscillation (ENSO) in the eastern Pacific Ocean.
  • The average November temperature for the global waters was a record high for the month, at 0.63°C (1.13°F) above the 20th century average, a record high for the month of November.
  • Remember blues indicate cooler than average temperatures and reds indicate warmer than average temperatures (white: average).

Snow and Ice Cover Dataset

Dataset: 20141221 EarthNow: November 2014 Snow and Ice Cover

Dataset: 20141221 EarthNow: AUDIO November 2014 Snow and Ice Cover


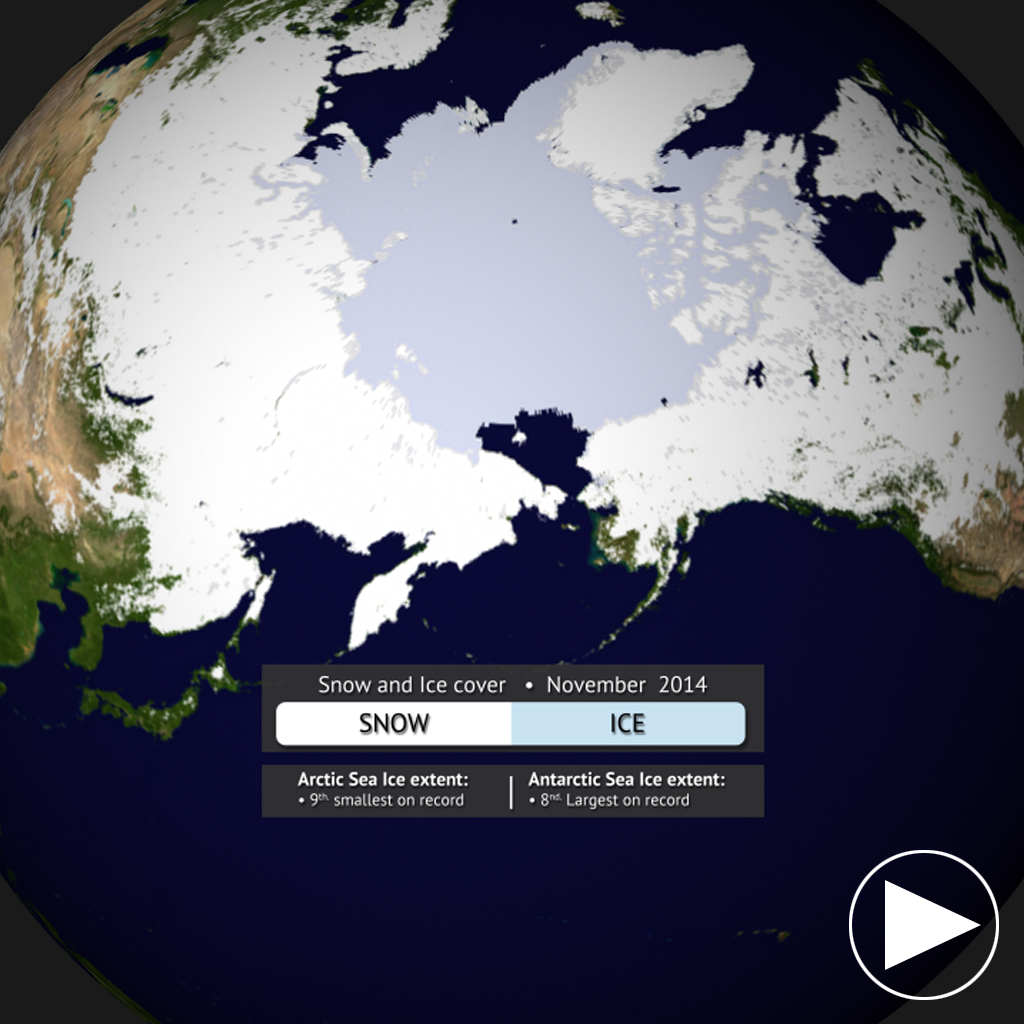
  • Aside from helping to illustrate seasonal changes, the real-time Snow and Ice Cover dataset is a great way to convey sea ice change through time, including discussing how the current sea ice extent compares to other noteworthy years.
  • The Arctic sea ice extent for November 2014 was 5.7% below the 1981-2010 average, making it the ninth smallest November sea ice extent since satellite records began in 1979.
  • In Antarctica, the sea ice extent was 2% above the 1981-2010 average, the eighth largest on record for the month of November.


Seasonal Outlooks

Be sure to check out the 3-month seasonal outlooks for January – March.

  • Global Temperature Outlook
  • Global Precipitation Outlook
  • U.S. Drought Outlook
Where do I find the datasets?
      • First, check your SOS system to make sure it’s not already in the EarthNow category.
      • If not, you can download the datasets and playlist files from this FTP Site.
      • Then download and use playlist files at the top of the page (or create your own) and make sure they are in /home/sos/sosrc or /home/sosdemo/sosrc.
      • More detailed information here
Helpful Resources for More Information
Credits:
EarthNow Team
NOAA
References:
NOAA National Climatic Data Center, State of the Climate: Global Analysis for August 2014, published online September 2014, retrieved on September 29, 2014 from http://www.ncdc.noaa.gov/sotc/global/.

 

Category: Climate Digest

1 Comment

GOES R – A glimpse into the future of Weather Satellites

Overview

The first satellite of the Geostationary Operational Environmental Satellites – R Series (GOES-R) is scheduled for launch in March 2016! There are many exciting improvements on the way and this short video introduces and demonstrates two of them:

Advanced Baseline Imager (ABI)
The GOES-R ABI will have 16 spectral bands, (compared to 5 on the current GOES Imager), resulting in three times more spectral information and four times the spatial resolution. The frequency of images, or temporal coverage, will be more than five times faster than the current GOES! This video shows 1 minute (super rapid scan) data from the GOES-14 satellite which emulates the improved temporal resolution planned for the ABI.

Geostationary Lightning Mapper (GLM)
The all new GLM on GOES-R will measure total lightning activity continuously over the Americas and adjacent ocean regions with near uniform spatial resolution of approximately 10 km! This video shows a simulation of this capability using the 1-minute imagery.

More information on GOES-R can be found at http://www.goes-r.gov/

Additional educational resources, including lesson plans developed by middle and high school science teachers, can be found at http://cimss.ssec.wisc.edu/education/goesr/

If the mp4 movie isn’t already in you SOS system in the EarthNow category, you can download the datasets and playlist files from this FTP Site.  Just download and use playlist files at the top of the page (or create your own) and make sure they are in /home/sosrc or /home/sosrc.

Credits:
EarthNow Team
Category: Atmosphere, Earth Systems, Severe Weather

1 Comment

October Climate Digest

climatedigest

Overview

Each month, we will provide information regarding the previous month’s climate. October 2014’s average global land and ocean temperature was the warmest October on record.

Highlights Dataset

Dataset: 20141121 EarthNow: October 2014 Highlights

Dataset: 20141121 EarthNow: AUDIO October 2014 Highlights


This dataset shows some of the major October weather and climate highlights from the National Climatic Data Center’s (NCDC) monthly global climate analysis, and serves as an overview of what can be discussed in the datasets that follow. Highlights are noted below.

  • Australia: Australia experienced its second warmest mean temperature in October on record.
  • Europe: Warmer than average temperatures.
  • United States: Fourth warmest October on record.
  • Japan: Above average rainfall.
  • Cyclone Hudhud: Hudhud struck the southeastern coast of India bring heavy rainfall.
  • Hurricane Gonzalo: First Category 4 hurricane to form in the Atlantic basin since Ophelia of 2011.

Sea Surface Temperature Anomalies Dataset

Dataset: 20141121 EarthNow: October 2014 SST Anomaly

Dataset: 20141121 EarthNow: AUDIO October SST Anomaly


  • The real-time sea surface temperature anomaly dataset is a great way to visualize the El Niño – Southern Oscillation (ENSO) in the eastern Pacific Ocean.
  • According to NOAA’s Climate Prediction Center, there is close to a 60% chance for a weak El Niño to develop during the Northern Hemisphere winter.
  • The average October temperature for the global waters was a record high for the month, at 0.62°C (1.12°F) above the 20th century average, the highest on record for October.
  • Remember blues indicate cooler than average temperatures and reds indicate warmer than average temperatures (white: average).

Snow and Ice Cover Dataset

Dataset: 20141121 EarthNow: October 2014 Snow and Ice Cover

Dataset: 20141121 EarthNow: AUDIO October 2014 Snow and Ice Cover


  • Aside from helping to illustrate seasonal changes, the real-time Snow and Ice Cover dataset is a great way to convey sea ice change through time, including discussing how the current sea ice extent compares to other noteworthy years.
  • The Arctic sea ice extent for October 2014 was 9.5% below the 1981-2010 average, making it the sixth smallest October sea ice extent since satellite records began in 1979.
  • In Antarctica, the sea ice extent was the second largest on record for the month of October.


Seasonal Outlooks

Be sure to check out the 3-month seasonal outlooks for December – February.

  • Global Temperature Outlook
  • Global Precipitation Outlook
  • U.S. Drought Outlook
Where do I find the datasets?
      • First, check your SOS system to make sure it’s not already in the EarthNow category.
      • If not, you can download the datasets and playlist files from this FTP Site.
      • Then download and use playlist files at the top of the page (or create your own) and make sure they are in /home/sos/sosrc or /home/sosdemo/sosrc.
      • More detailed information here
Helpful Resources for More Information
Credits:
EarthNow Team
NOAA
References:
NOAA National Climatic Data Center, State of the Climate: Global Analysis for August 2014, published online September 2014, retrieved on September 29, 2014 from http://www.ncdc.noaa.gov/sotc/global/.


Category: Climate Digest

0 Comments