January 2013 Climate Digest

January 2013 Climate Digest

January 2013 Climate Digest • iPad Video

SOS Playlists

SOS Playlist

Overview

Each month, we will provide information regarding the previous month’s climate. Overall, preliminary data analysis suggests that January 2013 was the 9th warmest on record (since 1880).  Major stories include warmer than normal United States, dry conditions in China, and snowy conditions for much of Eurasia.

January 2013 Highlights

January 2013 Highlights Preview • iPad Video

Highlights Dataset

Dataset Name: 20130222 EarthNow: January 2013 Highlights
Full Map Image
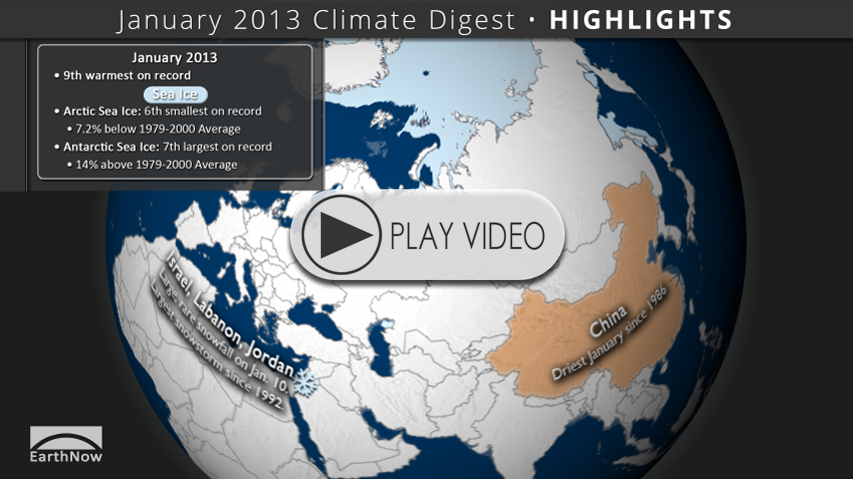
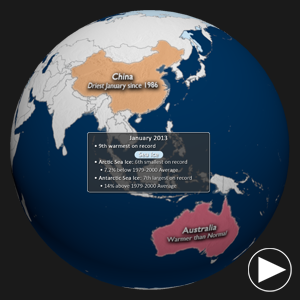
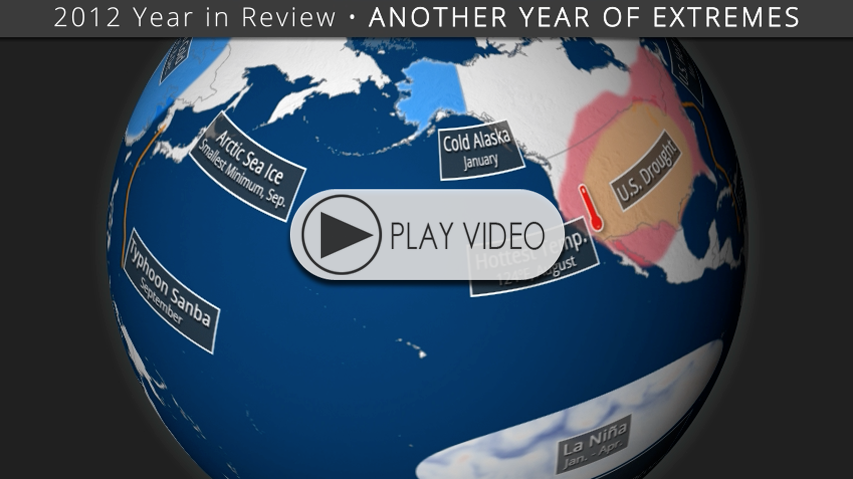
    • This dataset shows some of the major January weather and climate highlights from the National Climatic Data Center’s (NCDC) monthly global climate analysis, and serves as an overview of what can be discussed in the datasets that follow. Highlights are noted below with more information.
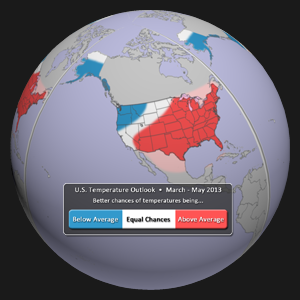
    • United States: 39th warmest on record (since 1895)
    • Australia: Highest maximum January temperature on record (1909). January 7th was also the warmest day on record, at 40.33˚C (104.59˚F)
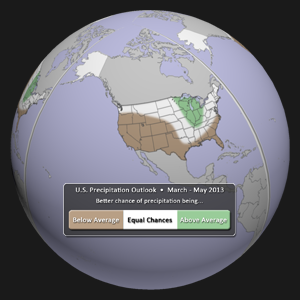
    • China: Driest January since 1986, at 6.7 mm below the 1981-2010 average.
    • Israel, Lebanon, Jordan: Unusual snowstorm was largest such storm since 1992. Up to 20 cm of snow fell on January 10th.
    • Arctic Sea Ice Extent: Sixth smallest on record, at 7.2% below the 1979-2000 average.
    • Antarctic Sea Ice Extent: Seventh largest on record, at 14.0% above the 1979-2000 average.
January 2013 Temperatures

January 2013 Temperatures Preview • iPad Video

Global Temperature Anomalies Dataset

Dataset Name: 20130222 EarthNow: RT Monthly Temperature Anomalies
Full Map Image
  • Using the real-time Monthly Temperature Anomalies dataset is a great way to convey where some of the warmer and cooler than average areas were in December, including those mentioned above in the highlights.
  • The combined global land and ocean average surface temperature for January was the 9th warmest on record (since 1880).
January 2013 SST Preview

January 2013 SST Preview • iPad Video

Sea Surface Temperature Anomalies Dataset

Dataset Name: 20130222 EarthNow: RT SST Anomalies
Full Map Image
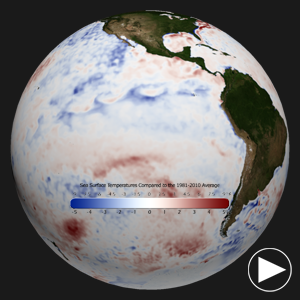
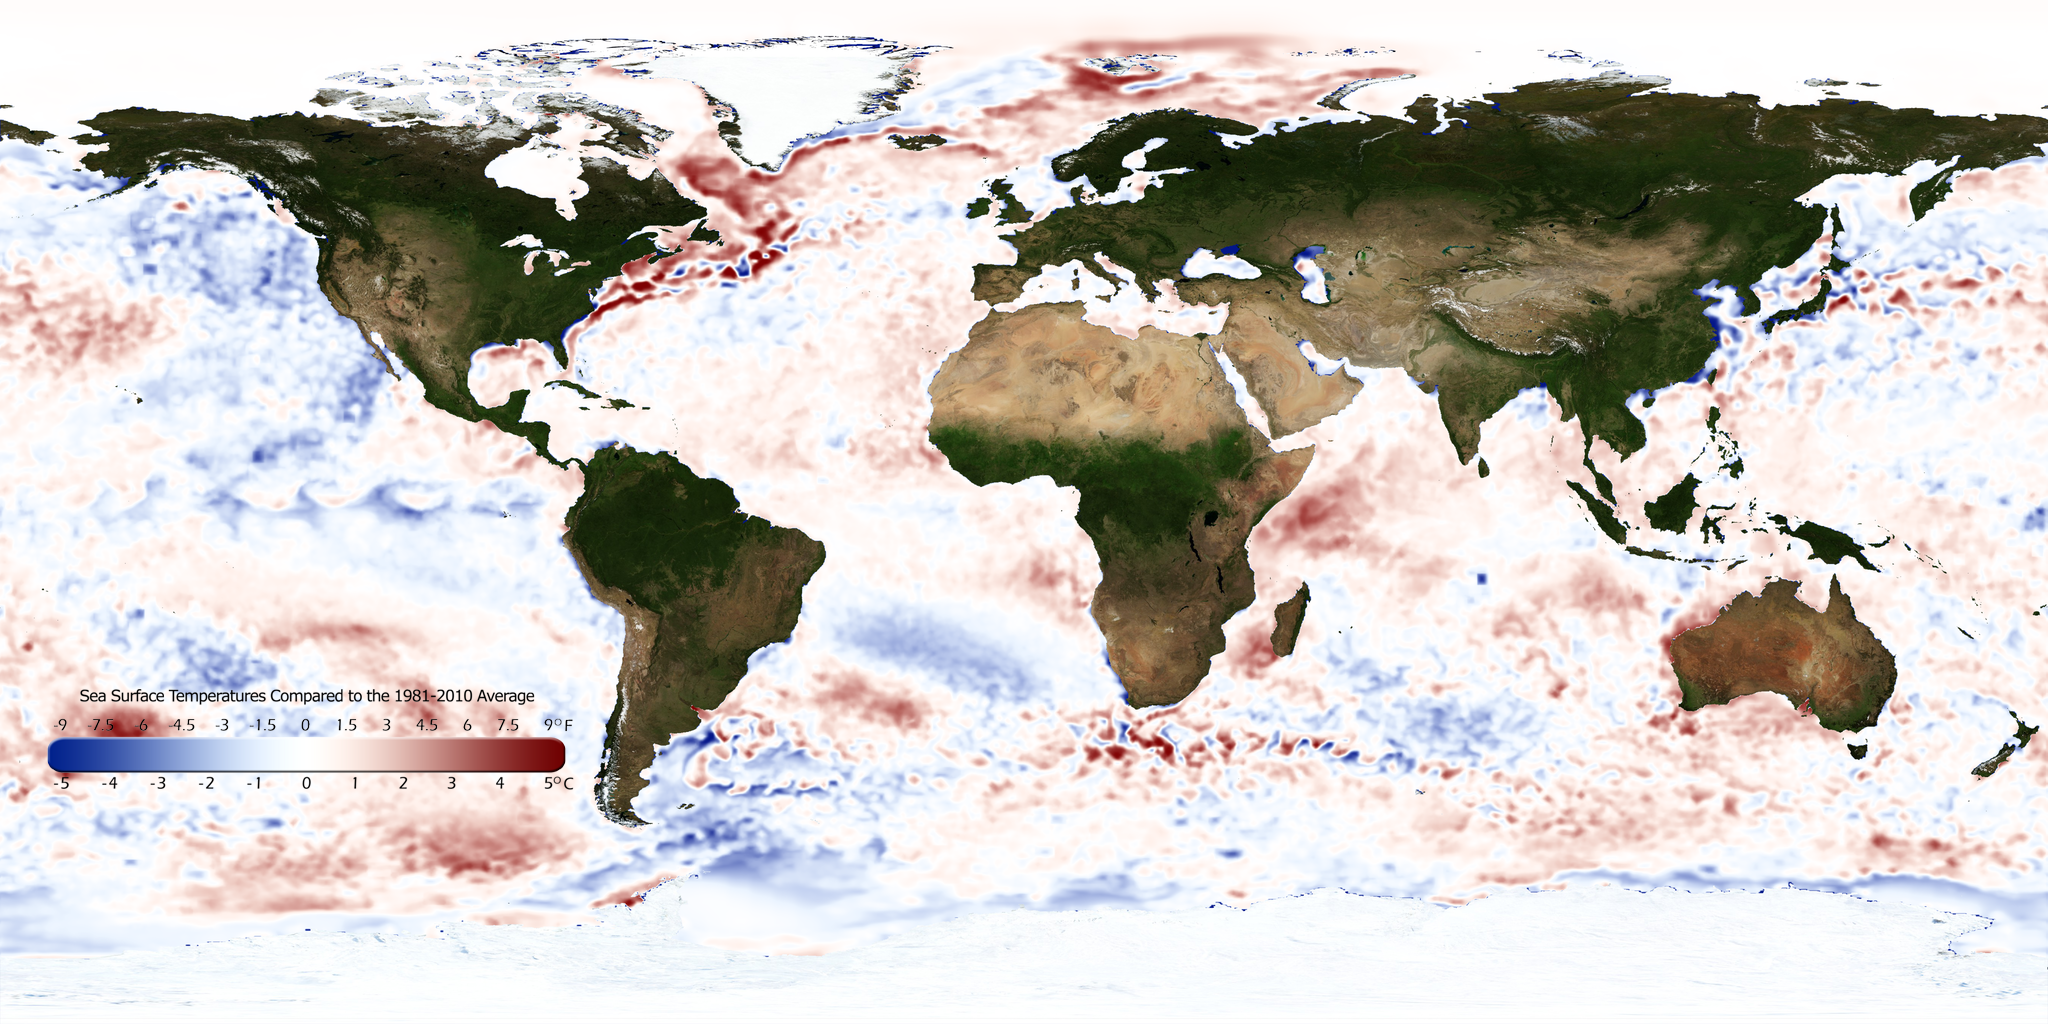
  • The real-time sea surface temperature anomaly dataset is a great way to visualize the El Niño – Southern Oscillation (ENSO) cycle in the eastern tropical Pacific ocean. For January 2013, these waters were just slightly below average, indicating an ENSO Neutral period.
  • Remember that the blues indicate cooler than average temperatures and reds indicate warmer than average temperatures (white: average).
January 2013 Snow and Ice

January 2013 Snow and Ice Preview • iPad Video

Snow and Ice Cover Dataset

Dataset Name: 20130222 EarthNow: RT Snow and Ice Cover
Full Map Image
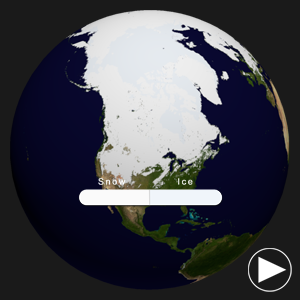
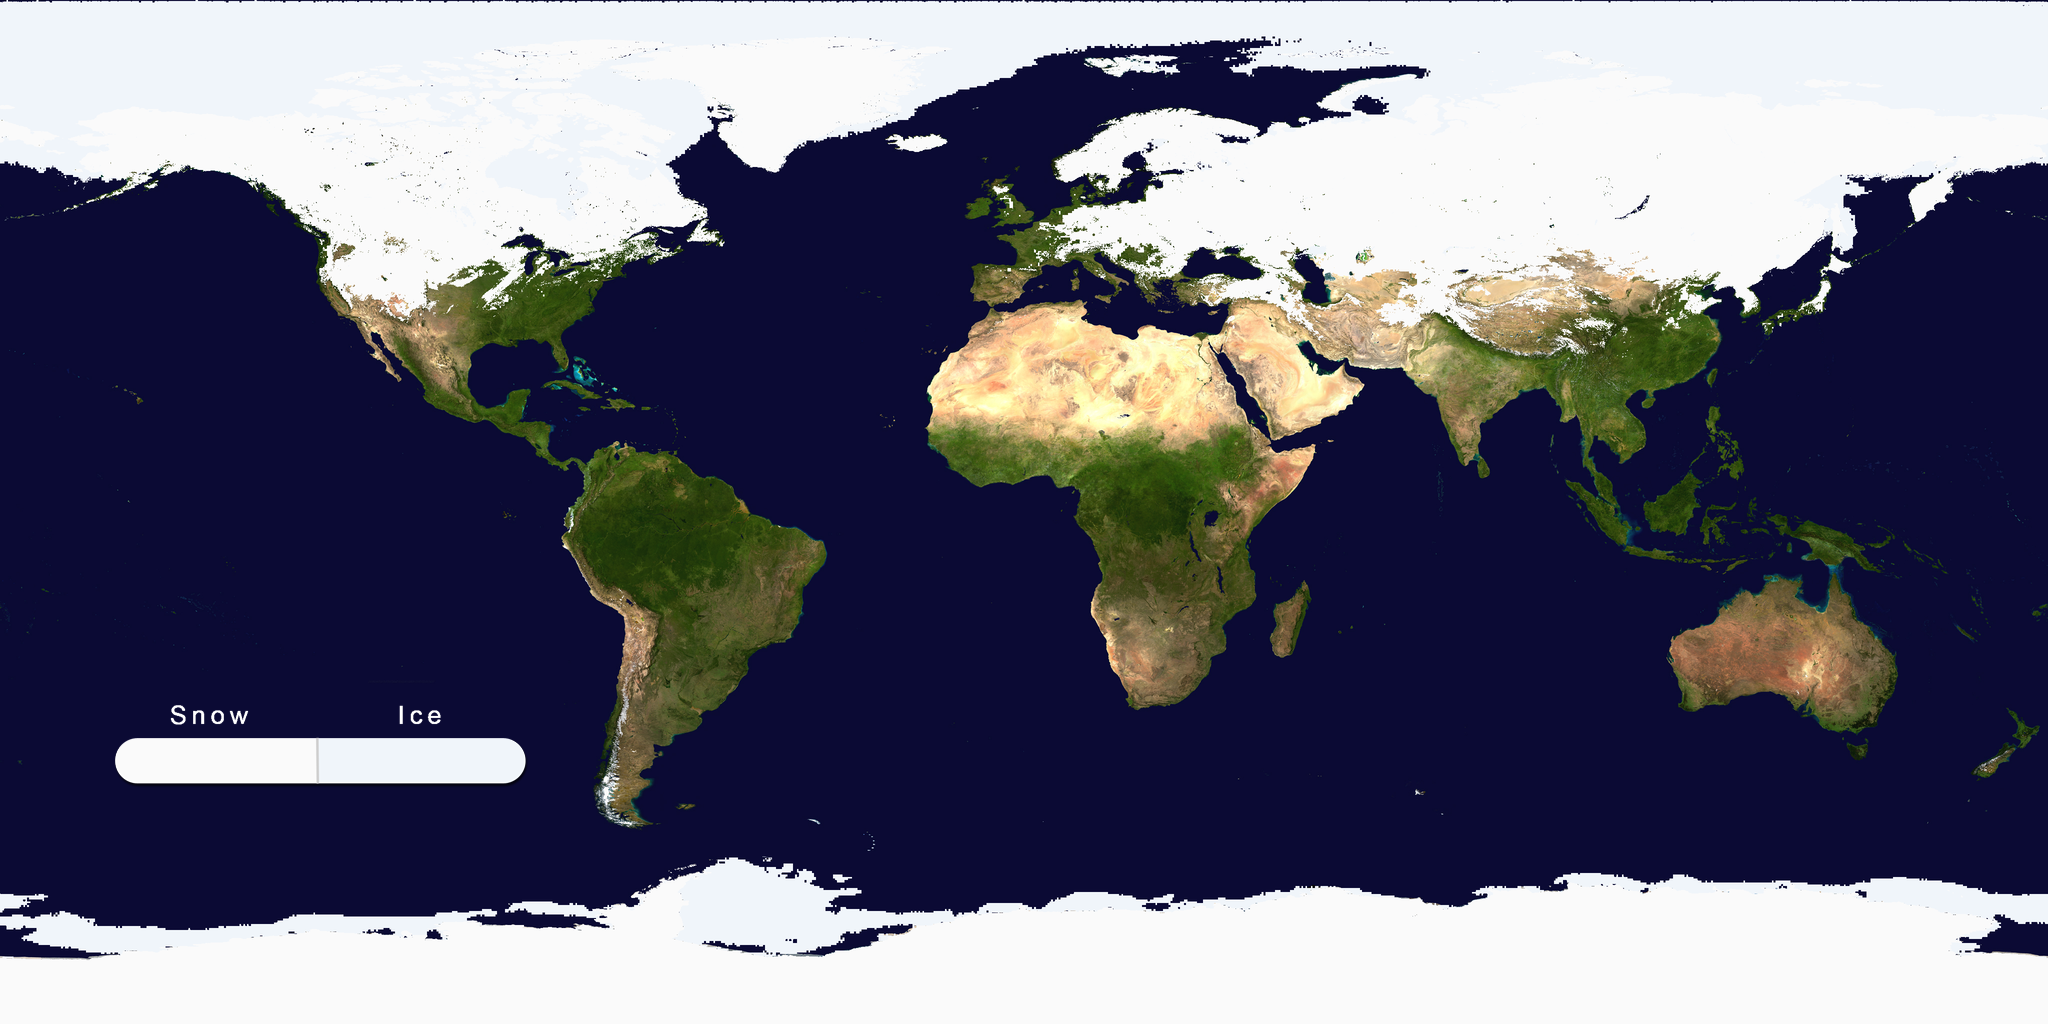
  • Aside from helping to illustrate seasonal changes, the real-time Snow and Ice Cover dataset is a great way to convey sea ice change through time, including discussing how the current sea ice extent compares to other noteworthy years.
  • The Arctic sea ice extent in January was the sixth smallest on record. The extent was 7.2% below the 1979-2000 average.
  • In Antarctica, the sea ice extent was the seventh largest on record, at 14.0% above the 1979-2000 average.
  • At 370,000 square kilometers above average, the North American snow cover extent was the 13th largest on record (since 1967).
  • The Eurasian snow cover extent was the sixth largest on record (since 1967), at 1.51 million square kilometers above average.
Where do I find the datasets?
  • First, check your SOS system to make sure it’s not already in the EarthNow category.
  • If not, you can download the datasets and playlist files from this FTP Site.
  • Then download and use playlist files at the top of the page (or create your own) and make sure they are in /home/sos/sosrc or /home/sosdemo/sosrc.
  • More detailed information here
Helpful Resources for More Information
Credits:
EarthNow Team
NOAA
References:
NOAA National Climatic Data Center, State of the Climate: Global Analysis for December 2012, published online January 2013, retrieved on January 17, 2013 from http://www.ncdc.noaa.gov/sotc/global/2012/12.
Category: Climate Digest
Tags: , ,
0 Comments

Climate Outlook for Early Spring (U.S.)

SOS Playlists

SOS Playlist

Overview

NOAA’s Climate Prediction Center expects a large area including much of the eastern two-thirds of the country to be warmer than normal. The Pacific Northwest and southern Alaska are expected to be cooler than normal. For more information about this, the precipitation outlook, and the drought outlook for the United States, read on!

U.S. Temperature Outlook

U.S. Temperature Outlook

U.S. Temperature Outlook

Dataset Name: 20130226 EarthNow: U.S. Temperature Outlook (March-May 2013)
Still Map Image
    • Sea Surface Temperatures in the ENSO (El Niño Southern Oscillation) region suggest continued neutral conditions, according to NOAA’s Climate Prediction Center.
    • For the March – May period, warmer than normal temperatures are expected for the eastern two-thirds of the United States. (Red)
    • Cooler than normal temperatures can be expected in the Pacific Northwest and southern Alaska. (Blue)
    • All other locations have equal chances of being warmer or cooler than normal. (White)
    • Outlook by NOAA’s Climate Prediction Center (CPC)
    • In its forecasts, the CPC uses a wide variety of models in conjunction with looking at climate variables (like El Niño).
    • It should be noted that areas in the “warmer than normal” region may still have cooler than normal days. This outlook only suggests that after the three months are over, those areas in the “warmer than normal” region are more likely to have experienced warmer than normal average temperatures.
U.S. Precipitation Outlook

U.S. Precipitation Outlook

U.S. Precipitation Outlook

Dataset Name: 20130226 EarthNow: U.S. Precipitation Outlook (March-May 2013)
Still Map Image
  • For the next three months (March – May), drier than normal conditions are expected for the southwest U.S. and much of the southern coastal regions. (Brown)
  • Wetter than normal conditions are expected the Great Lakes region, extending down through the Mississippi River valley. (Green)
  • All other locations have equal chances of being wetter or drier than normal. (White)
  • Outlook by NOAA’s Climate Prediction Center (CPC)
  • In its forecasts, the CPC uses a wide variety of models in conjunction with looking at climate variables (like El Niño).
  • It should be noted that areas be in the “drier than normal” region may still have rainy or snowy days. This outlook only suggests that after the three months are over, those areas in the “drier than normal” region are more likely to have experienced drier than normal averages.
U.S. Drought Outlook

U.S. Drought Outlook

U.S. Drought Outlook

Dataset Name: 20130226 EarthNow: U.S. Drought Outlook (March-May 2013)
Still Map Image
    • With so much of the country experiencing drought conditions, and with the potential for severe social and economic impacts, it’s important to provide some insight into the seasonal drought outlook for the United States.
    • This dataset shows the NOAA Climate Prediction Center (CPC) U.S. drought outlook for March – May 2013.
    • Much of the central and western parts of the U.S. are expected to have drought conditions persist or even intensify. Unfortunately, these are the areas with the most agricultural interest. Parts of Florida can also expect their drought conditions to persist.
    • The extreme southeastern U.S. may experience some improvement, along with the western Great Lakes region.
    • Drought development regions are spotty, but prevalent in the western United States.
Where do I find the datasets?
  • First, check your SOS system to make sure it’s not already in the EarthNow category.
  • If not, you can download the dataset and playlist files from this FTP Site.
  • Then download and use playlist file(s) at the top of the page (or create your own) and make sure they are in /home/sos/sosrc or /home/sosdemo/sosrc.
  • More detailed information here
Helpful Resources for More Information
Credits:
EarthNow Team
NOAA
References:
NOAA Climate Prediction Center, 3-month Outlook Discussion, http://www.cpc.ncep.noaa.gov/products/predictions/90day/fxus05.html
NOAA Climate Prediction Center, 3-month Outlook Maps, http://www.cpc.ncep.noaa.gov/
Category: U.S. Outlook
Tags: , ,
0 Comments

2012: Another Year of Extremes

2012 Year in Review

2012 Year in Review

SOS Playlists

SOS Playlist

Overview

For this EarthNow entry, we thought it would be nice to do a global review of 2012, with regards to major weather and earth science events, as well as some important climate measurements. The bullet points below will simply tell you about how the dataset works. Below the bullet points, you will find more information regarding the events. For even more information, check out the references at the end. Enjoy!

2012 Year in Review

Dataset Name: 20130205 EarthNow: 2012 Year in Review
Still Map Image
  • This dataset contains a sequence of 15 frames, or images. The first frame is the “Title Frame.” The next 12 frames contain 1 frame for each month of 2011, with the last two frames being conclusion frames, highlighting all of the events of 2012.
  • When you load the dataset, the animation will not start by default, allowing you to step through frame by frame using the remote. You can of course “Play” the animation, during which each frame will last for 10 seconds. These settings can be changed in the playlist setting for the file.

Monthly Highlights

January

  • La Niña: Weak to moderate La Niña, held over from 2011, in effect from January through April.
  • Alaska Extra Cold: We all know that Alaska can be cold, but the state experienced its coldest January on record in 2012.
  • Eurasia Cold: A cold wave affected much of the Eurasian continent from January through February. More than 650 fatalities occurred as a result.
  • U.K. Dry: The United Kingdom experienced dry conditions for January through March.

February

  • La Niña continues
  • Eurasia remains cold
  • U.K. remains dry

March

  • La Niña continues
  • U.K. remains dry
  • U.S. Heat Wave: An early-season heat wave affected much of the contiguous United States from March through May.

April

  • La Niña continues
  • U.S. Heat Wave continues
  • U.K. Dry No More: After a dry start to the year, the United Kingdom experienced a wetter than normal rest of the year. By the end of the year, the U.K. had experienced its second wettest year on record, behind 2000.

May

  • La Niña transitions into a Neutral phase
  • U.S. Heat Wave continues
  • U.K. remains wetter than normal

June

  • U.K. remains wetter than normal
  • Russian Drought: Western Russian and Siberia experienced drought conditions from June through July.
  • U.S. Drought Index: The U.S. drought severity index was at 55%, the largest percentage since December 1956.

July

  • U.K. remains wetter than normal
  • Russian Drought continues
  • African Flooding: Western and central Africa experienced severe flooding from July through October. Over 3 million people were affected, destroying crops, homes, and schools. The flooding also resulted in outbreaks of several diseases.

August

  • U.K. remains wetter than normal
  • African Flooding continues
  • Argentina Flooding: Heavy rainfall resulted in flooding in eastern Argentina.
  • Hottest Temperature of 2012: The hottest temperature of 2012 occurred on August 17th in Death Valley, California. The temperature was 124˚F (51.1˚C).

September

  • U.K. remains wetter than normal
  • African Flooding continues
  • Coldest Temperature of 2012: The coldest temperature of 2012 occurred on September 15th at the Vostok Antarctic Research Station. The temperature was -119.6˚F (-84.2˚C).
  • Arctic Sea Ice Minimum: During the melt season, the Arctic sea ice extent reached its lowest extent on record (since 1979).
  • Antarctic Sea Ice Maximum: During the growth season, the Antarctic sea ice extent reached its largest extent on record (since 1979).
  • Typhoon Sanba: With maximum winds of 280 km/hr, Typhoon Sanba was the strongest tropical cyclone of 2012. Occurring September 10-19, the storm impacted the Philippines, Japan, and the Korean Peninsula with heavy rains, flooding, and landslides.
  • U.S. Drought: By September 2012, over two-thirds of the nation was experiencing drought conditions.
  • Pakistan Flooding: Pakistan was impacted by heavy rains and flooding, with over 5 million people affected and 460,000 houses damaged or destroyed.

October

  • U.K. remains wetter than normal
  • African Flooding continues
  • Hurricane Sandy: With maximum winds of 175 km/hr, Hurricane Sandy was the most noted storm for the Atlantic basin in 2012. First impacting the Caribbean and claiming about 80 lives, Sandy then impacted the U.S. eastern seaboard, including a sharp westward turn into the highly populated northeast region, where Sandy resulted in over 130 fatalities.

November

  • U.K. remains wetter than normal
  • Argentina Flooding: Once again, eastern Argentina experienced heavy rain and flooding for November through December.

December

  • U.K. remains wetter than normal
  • Argentina flooding continues
  • Eurasia Cold: After starting 2012 with extremely cold temperatures, much of the Eurasian region ended 2012 with below normal, record-breaking cold temperatures.
Where do I find the datasets?
  • First, check your SOS system to make sure it’s not already in the EarthNow category.
  • If not, you can download the dataset and playlist files from this FTP Site.
  • Then download and use playlist file(s) at the top of the page (or create your own) and make sure they are in /home/sos/sosrc or /home/sosdemo/sosrc.
Credit(s):
EarthNow Team
NOAA
References:
EarthWeek 2012 Annual Summary, http://www.earthweek.com/
NOAA National Climatic Data Center, State of the Climate: Global Analysis for Annual 2012, published online December 2012, retrieved on February 7, 2013 from http://www.ncdc.noaa.gov/sotc/global/2012/13.
WMO, Provisional Statement on the Status of the Global Climate, http://www.wmo.int/pages/mediacentre/press_releases/documents/966_WMOstatement.pdf
Category: Annual Review
Tags: ,
0 Comments