
SOS Playlists
 SOS Playlist
Overview
NOAA’s Climate Prediction Center expects a large area extending Mississippi up through Nevada, as well as the Northeast, to be warmer than normal. The northern plains, Pacific Northwest, and southern Alaska are expected to be cooler than normal. For more information about this, the precipitation outlook, and the drought outlook for the United States, read on!
U.S. Temperature Outlook
U.S. Temperature Outlook
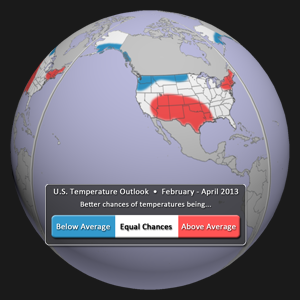
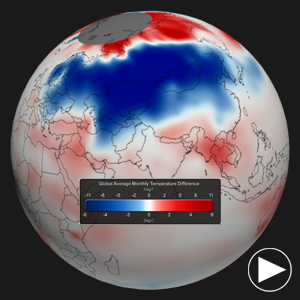
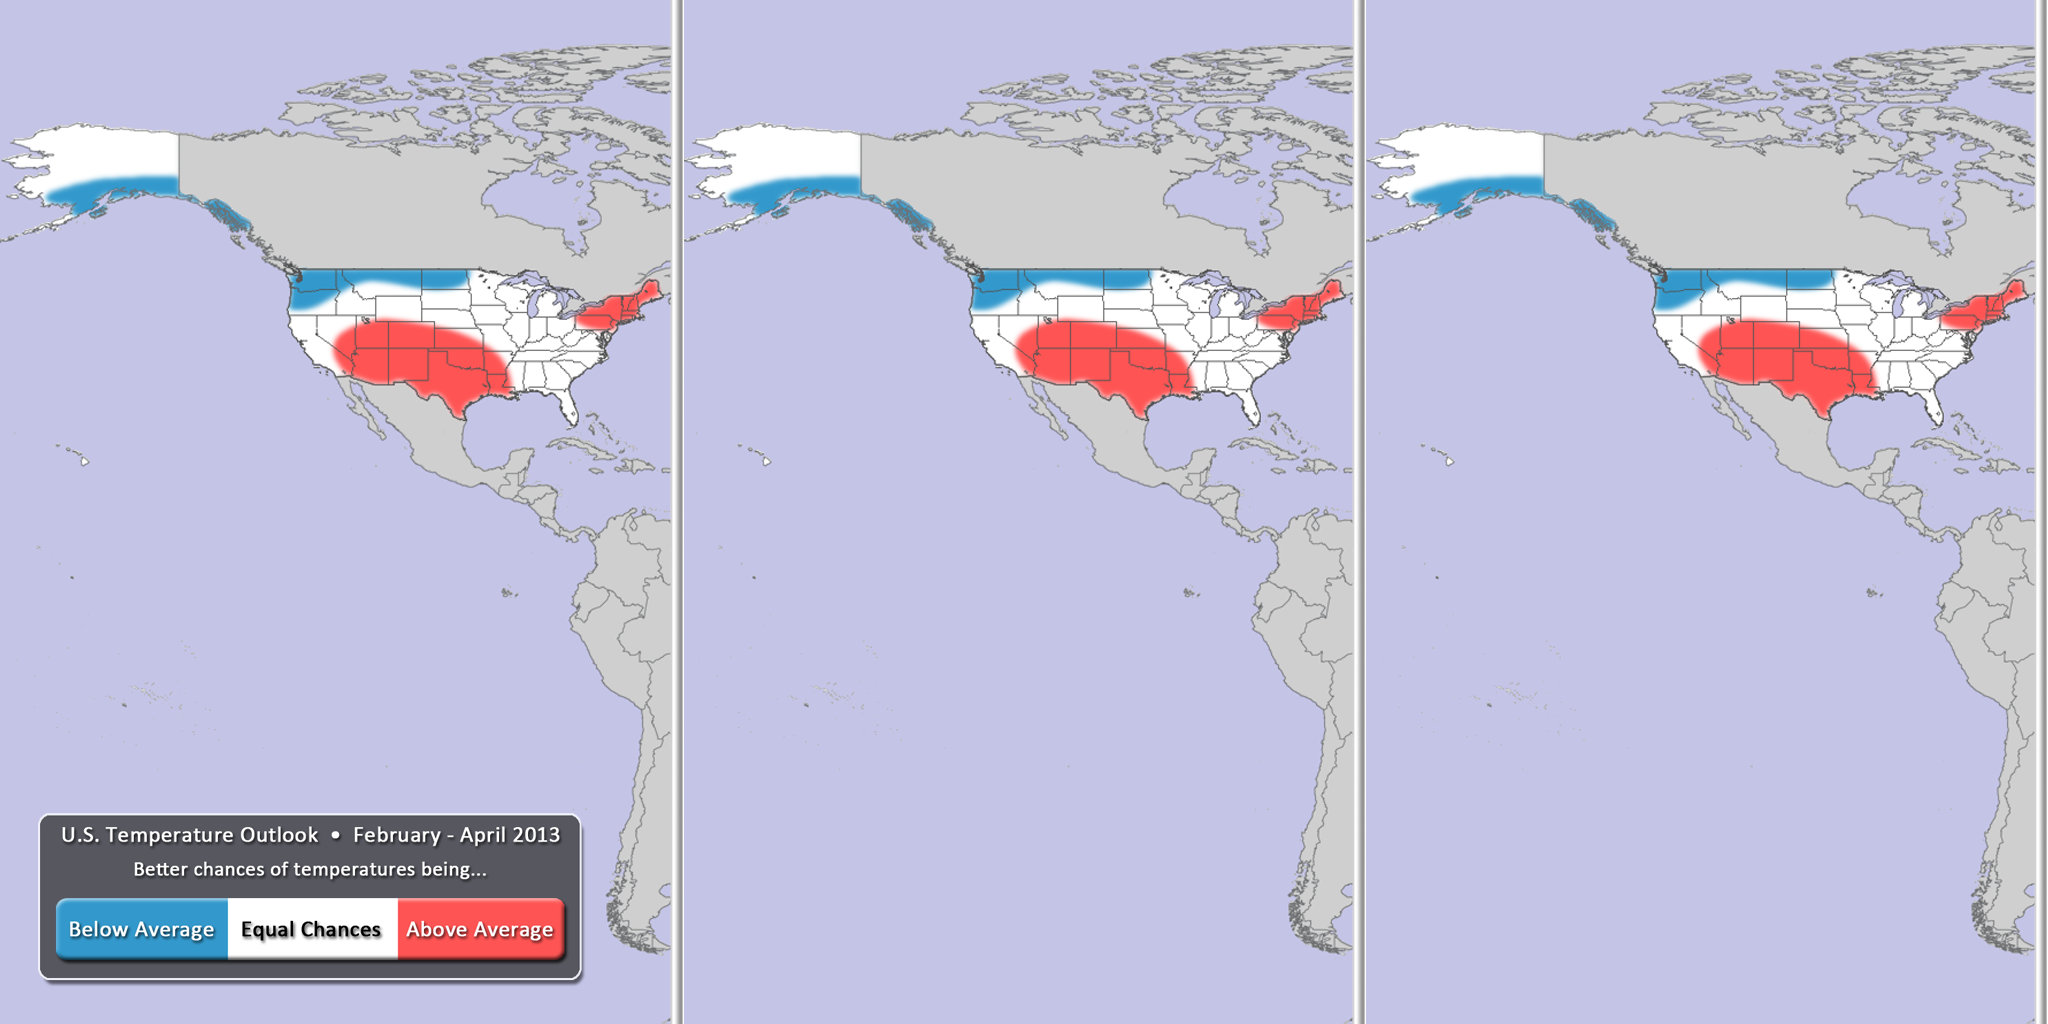
Dataset Name: 20130128 EarthNow: U.S. Temperature Outlook (February-April 2013)
 Still Map Image
- Sea Surface Temperatures in the ENSO (El Niño Southern Oscillation) region suggest continued neutral conditions, according to NOAA’s Climate Prediction Center.
- For the February – April period, warmer than normal temperatures are expected for the northeastern, south-central, and southwest United States. (Red)
- Cooler than normal temperatures can be expected in the northern plains, Pacific Northwest, and southern Alaska. (Blue)
- All other locations have equal chances of being warmer or cooler than normal. (White)
- Outlook by NOAA’s Climate Prediction Center (CPC)
- In its forecasts, the CPC uses a wide variety of models in conjunction with looking at climate variables (like El Niño).
- It should be noted that areas in the “warmer than normal” region may still have cooler than normal days. This outlook only suggests that after the three months are over, those areas in the “warmer than normal” region are more likely to have experienced warmer than normal average temperatures.
U.S. Precipitation Outlook
U.S. Precipitation Outlook
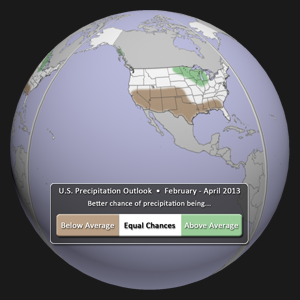
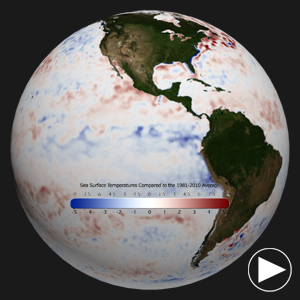
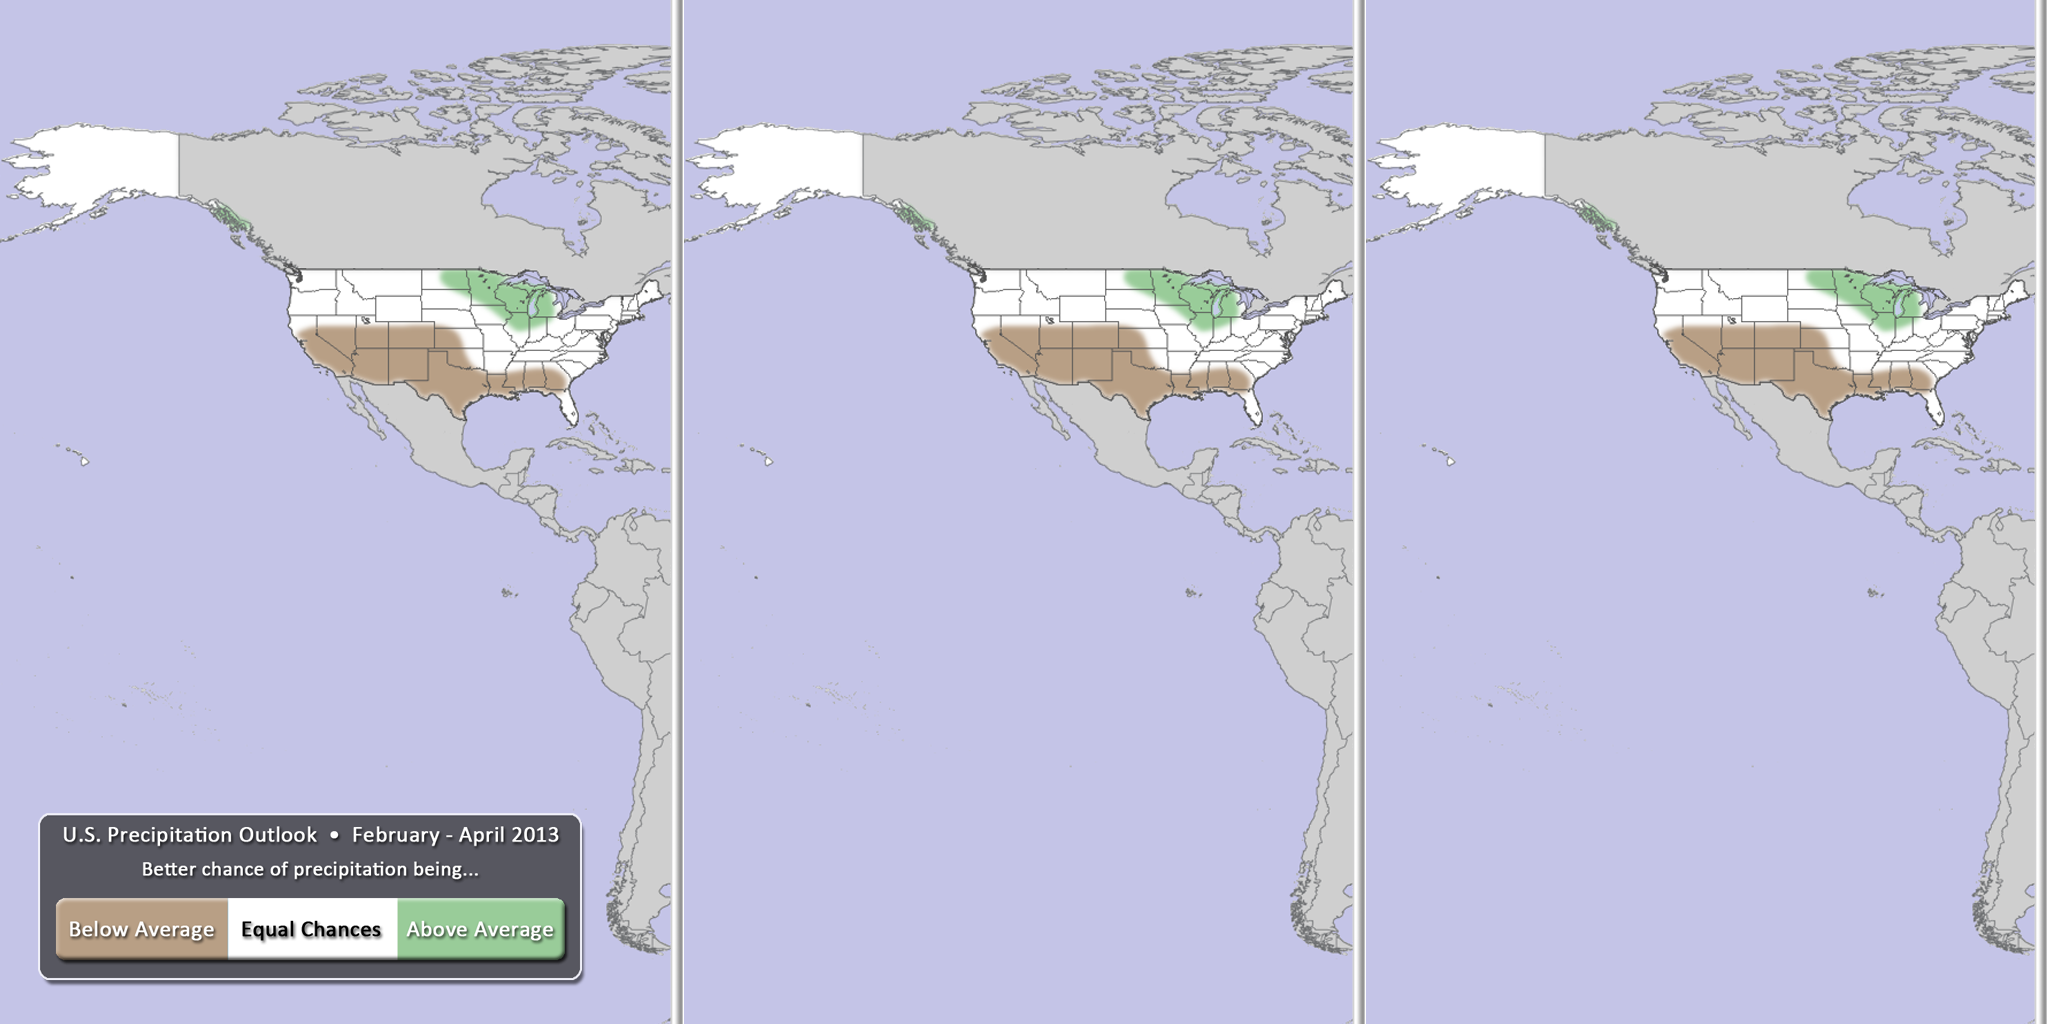
Dataset Name: 20130128 EarthNow: U.S. Precipitation Outlook (February-April 2013)
Still Map Image
- For the next three months (February – April), drier than normal conditions are expected for the southwest U.S., extending eastward through the Gulf coast states. (Brown)
- Wetter than normal conditions are expected for much of the Midwest, extending into North Dakota. (Green)
- All other locations have equal chances of being wetter or drier than normal. (White)
- Outlook by NOAA’s Climate Prediction Center (CPC)
- In its forecasts, the CPC uses a wide variety of models in conjunction with looking at climate variables (like El Niño).
- It should be noted that areas be in the “drier than normal” region may still have rainy or snowy days. This outlook only suggests that after the three months are over, those areas in the “drier than normal” region are more likely to have experienced drier than normal averages.
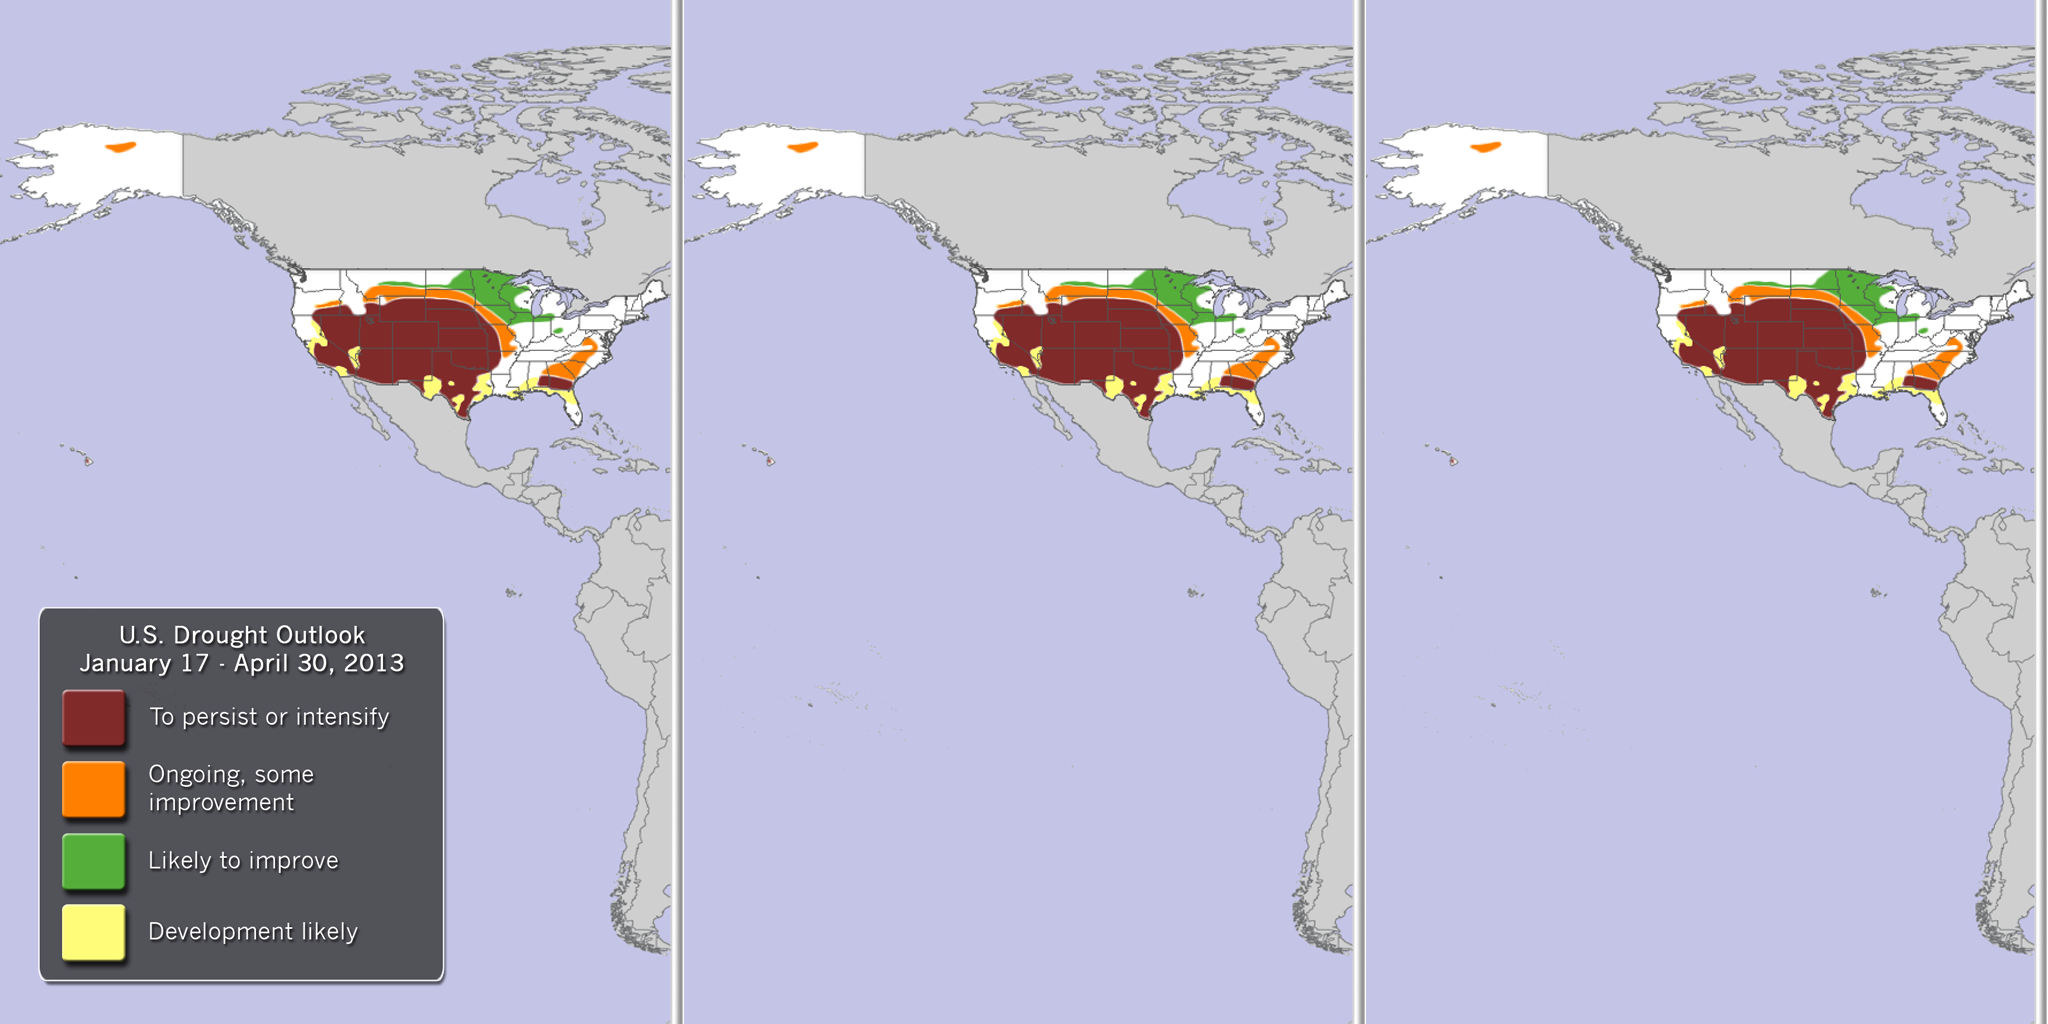
U.S. Drought Outlook
U.S. Drought Outlook
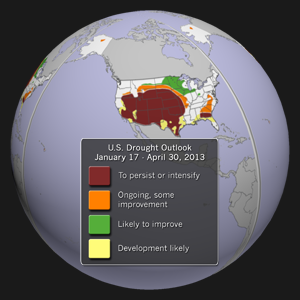
Dataset Name: 20130128 EarthNow: U.S. Drought Outlook (February-April 2013)
Still Map Image
-
- With so much of the country experiencing drought conditions, and with the potential for severe social and economic impacts, it’s important to provide some insight into the seasonal drought outlook for the United States.
- This dataset shows the NOAA Climate Prediction Center (CPC) U.S. drought outlook for February – April 2013.
- Much of the central and western parts of the U.S. are expected to have drought conditions persist or even intensify. Unfortunately, these are the areas with the most agricultural interest.
- The southeastern U.S. will continue to have drought, with some improvement possible.
- The only areas expected to have some improvement are the northern plains and western Great Lakes, likely due to winter precipitation.
Where do I find the datasets?
-
First, check your SOS system to make sure it’s not already in the EarthNow category.
-
If not, you can download the dataset and playlist files from this FTP Site.
-
Then download and use playlist file(s) at the top of the page (or create your own) and make sure they are in /home/sos/sosrc or /home/sosdemo/sosrc.
Helpful Resources for More Information
-
http://www.cpc.ncep.noaa.gov/products/predictions/90day/fxus05.html NOAA CPC Outlook Discussion
-
http://www.ncdc.noaa.gov/sotc/briefings NOAA Climate Report Briefings


