Spring 2019 Climate Digest

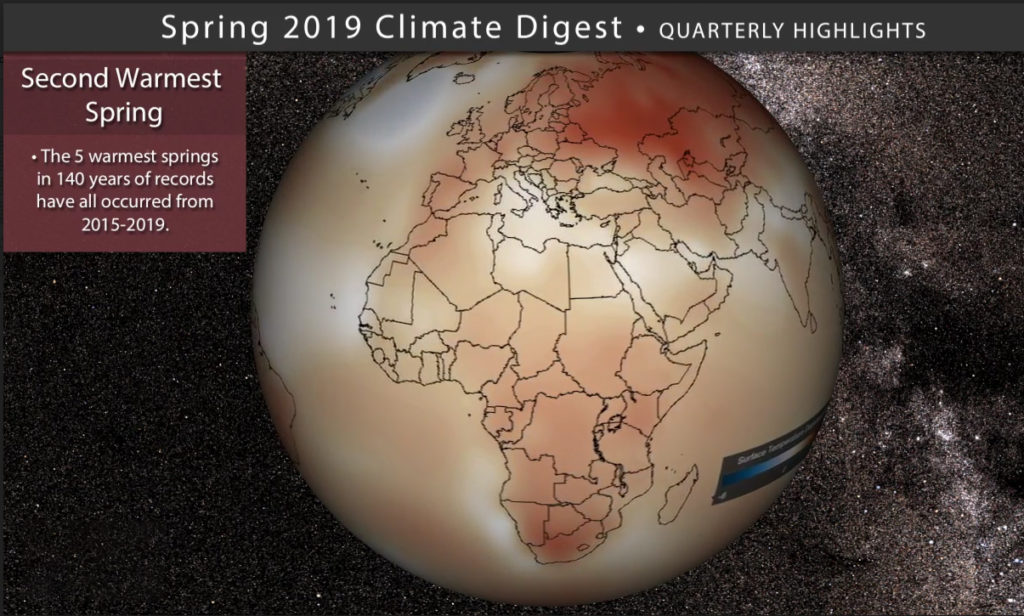
Spring 2019 was the second warmest March through May for the global land and ocean surfaces in the 140-year record coming in at 1.73°F (nearly a full degree Celsius) above the 20th century average.

Of note: the five warmest March–May periods have all occurred since 2015.

The global land-only temperature for spring 2019 was also second highest on record.

In the continental United States meteorological spring had near-average temperatures. However, precipitation was nearly 2 inches above average making spring 2019 the sixth wettest on record. Kansas had its wettest spring on record and severe flooding occurred along several major rivers in the central United States. In fact, the 12-month period from June 2018 to May 2019 was the wettest on record for the United States with 37.68” of precipitation pushing the time period into a clear first place among all year-long totals going back to 1895.

Not surprisingly, most of the U.S. started the summer drought-free.

The quarterly climate digest, produced seasonally, consists of a short movie (4:47 minutes) made for Science On a Sphere® (SOS) and an MP4 video accessible through YouTube.

You can download the SOS content from this FTP Site.

Content includes:
– Global 3-month land temperatures
– 3-month Sea Surface Temperature (SST) anomalies
– Temperature and precipitation graphics for the U.S.
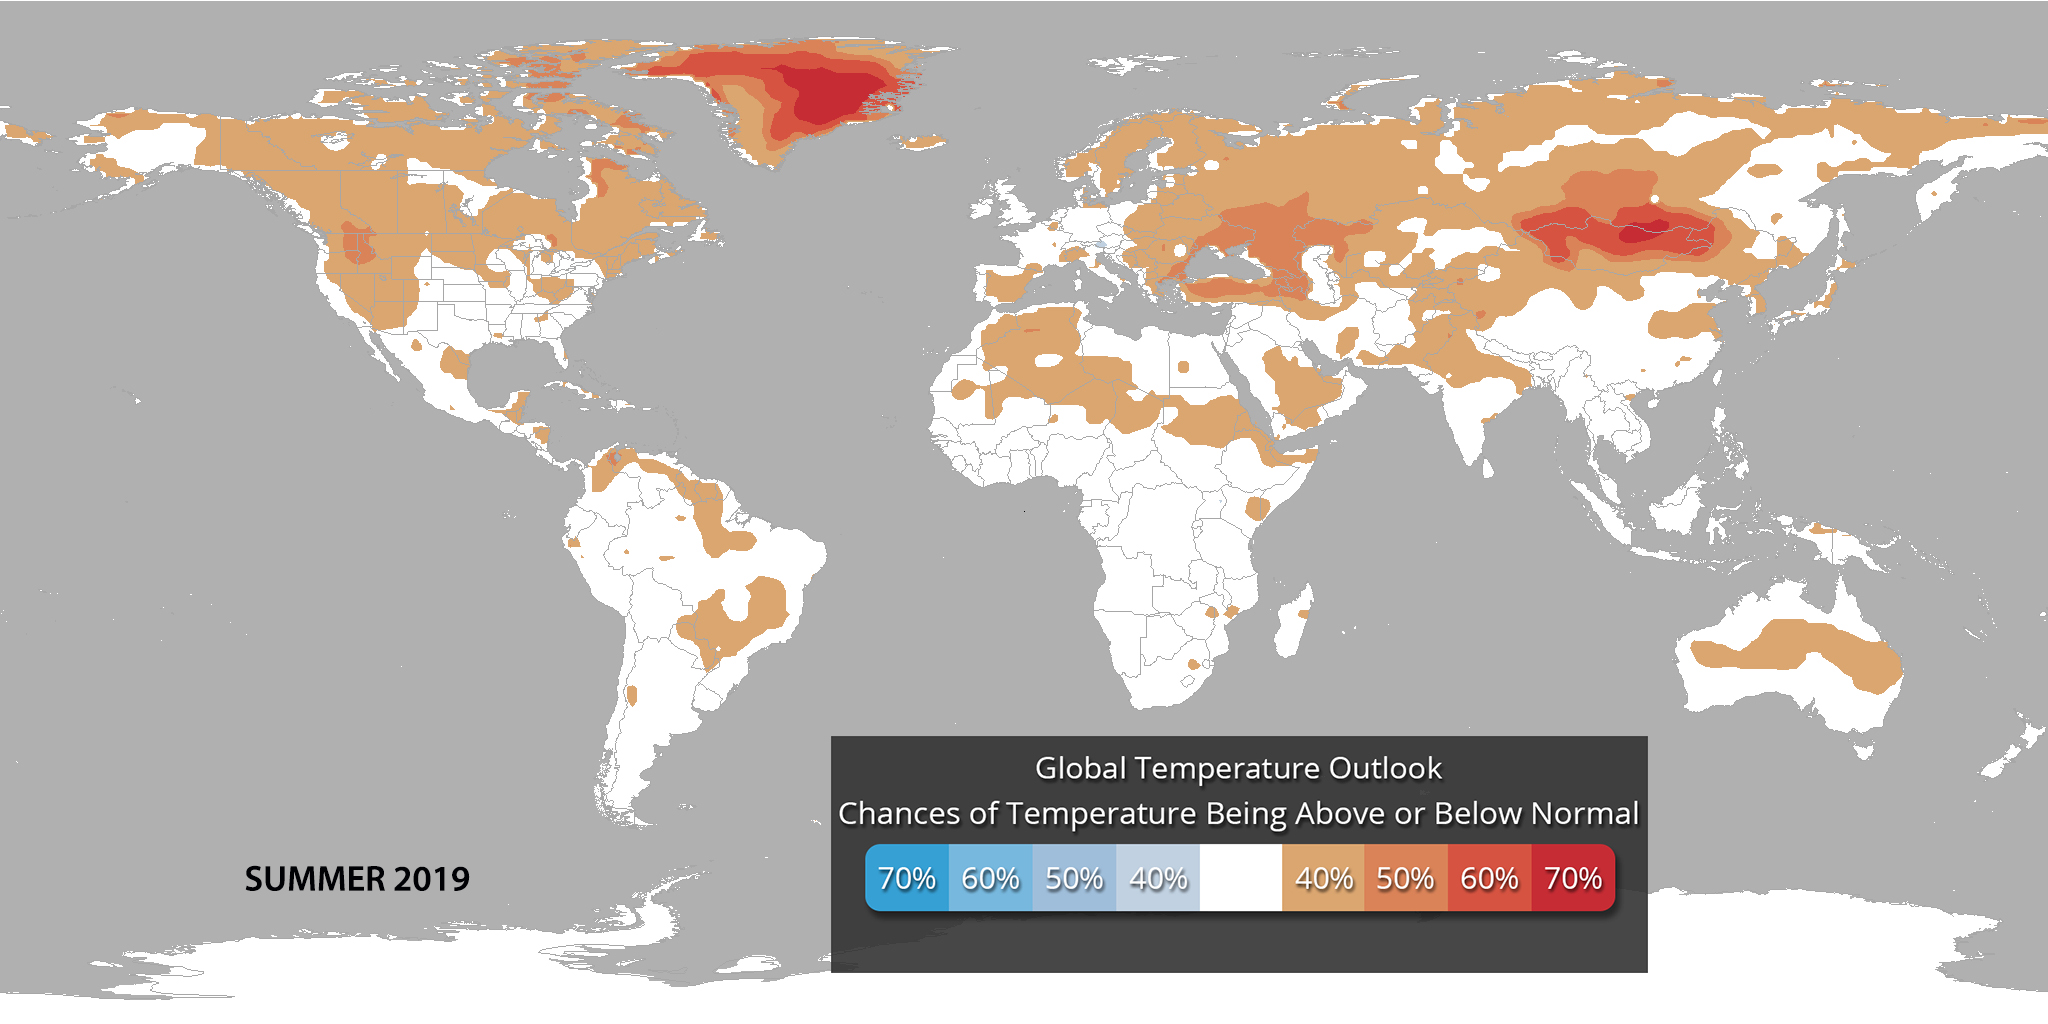
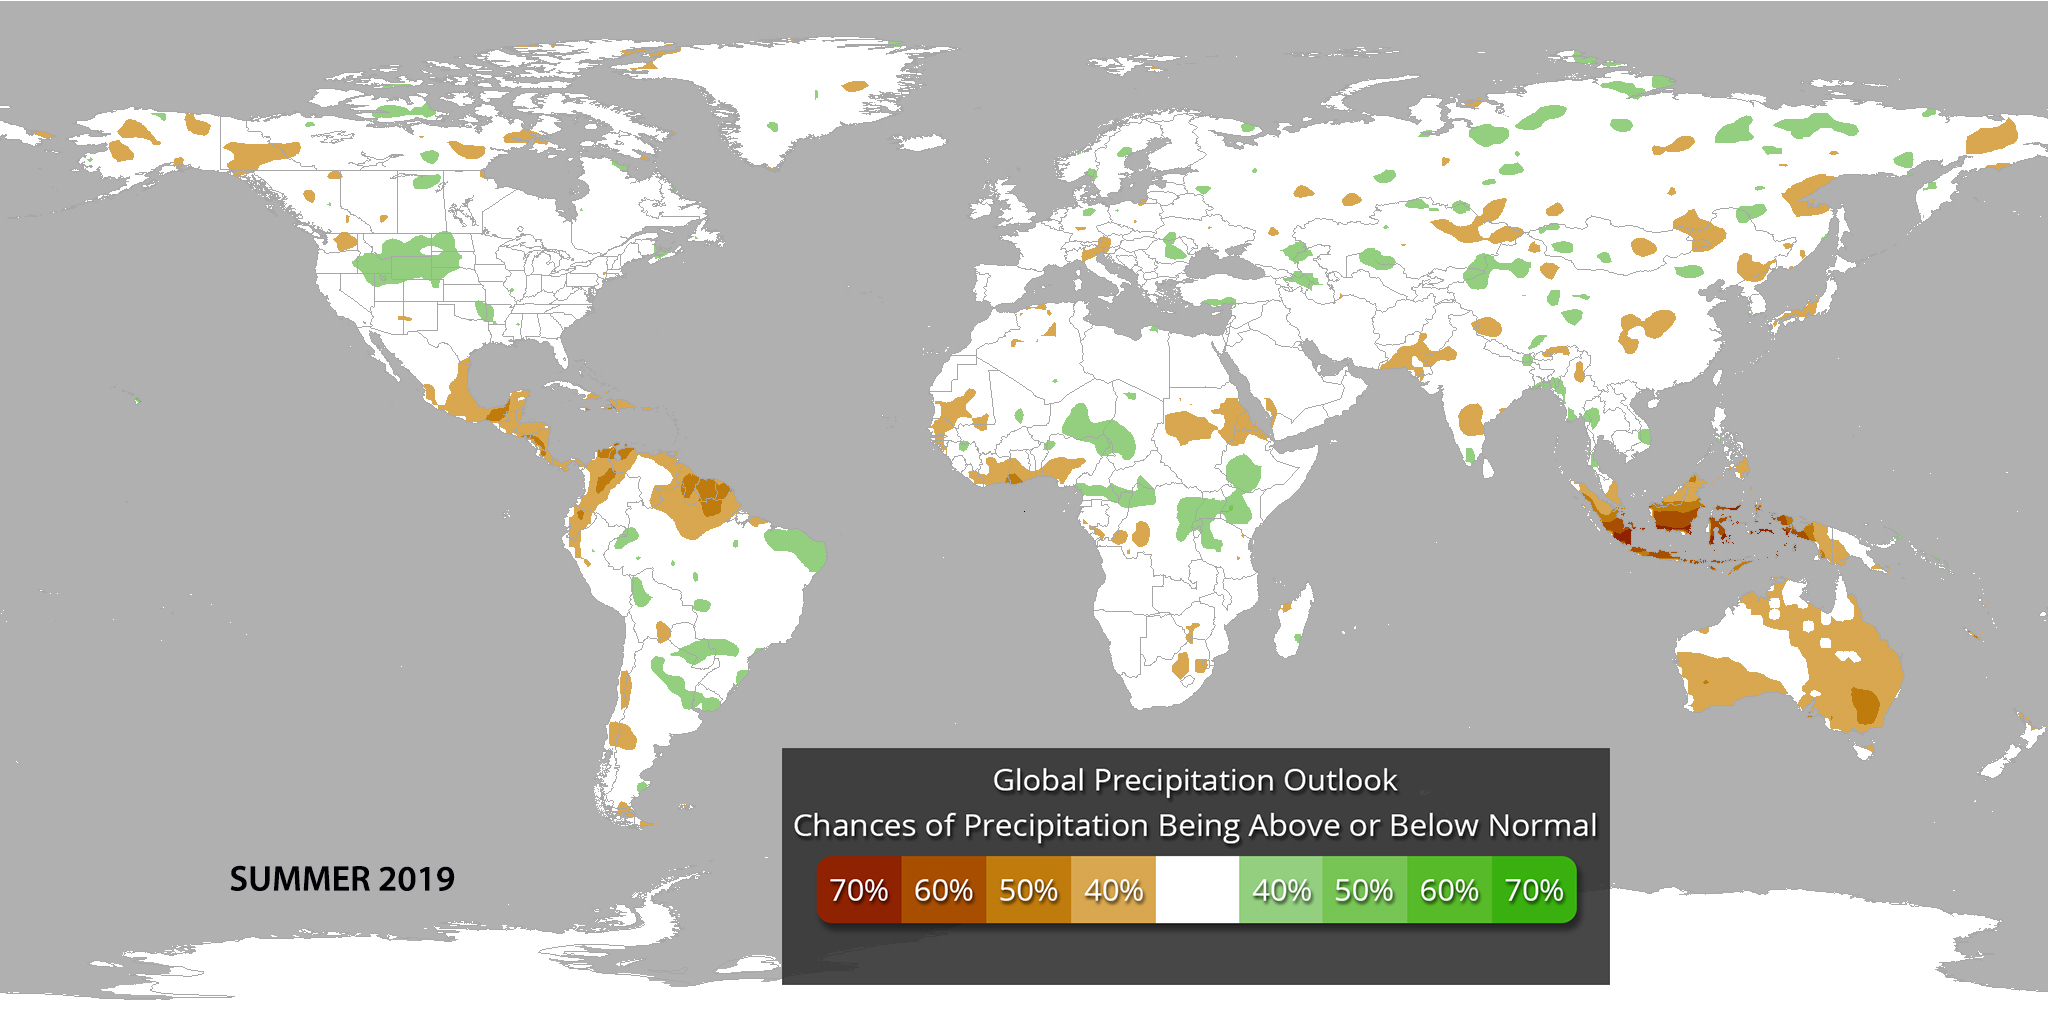
– Global temperature and precipitation outlooks for summer

References:
https://www.ncdc.noaa.gov/sotc/global/201905
https://www.ncdc.noaa.gov/sotc/national/201905
River flooding inundates the Northern Plains in spring 2019

Credits:
EarthNow Team
National Oceanic and Atmospheric Administration(NOAA)

Monthly state of the climate reports are available from NOAA National Centers for Environmental Information (NCEI) Climate Global Analysis and National Overview at https://www.ncdc.noaa.gov/sotc/


Category: Climate Digest

Comments Off on Spring 2019 Climate Digest
comments 
Comments Off on Spring 2019 Climate Digest

Seasonal Outlooks (June, July and August 2019)

Overview

The data for the global temperature and precipitation outlooks are provided by the International Research Institute for Climate and Society (IRI).  The IRI was established as a cooperative agreement between NOAA’s Climate Program Office and Columbia University. It is part of The Earth Institute, Columbia University. These maps are constructed primarily with data from NOAA climate models, with some minor tweaks by climatologists.

Temperature Outlook

  • What does RED mean on the map? The red shading on the map indicates areas that have a higher probability (greater than 35%) of being “warmer than normal”, than “normal”, or “cooler than normal”.
  • What does BLUE mean on the map? The blue shading on the map indicates areas that have a higher probability (greater than 35%) of being “cooler than normal”, than “normal”, or “warmer normal”.
  • WHITE indicates areas that have a higher probability of being “normal” than “cooler or warmer than normal” and also, areas where the chances for being cooler than normal, warmer than normal, and normal are equal.

It should be noted that areas in the “warmer than normal” region may still have cooler than normal days, and may not be “hot”. This outlook only suggests that after the three months are over, those areas in the “warmer than normal” region are more likely to have experienced warmer than normal average temperatures.

Precipitation Outlook

  • What does GREEN mean on the map? The green shading on the map indicates areas that have a higher probability (greater than 35%) of being “wetter than normal”, than “normal”, or “drier than normal”.
  • What does BROWN mean on the map? The brown shading on the map indicates areas that have a higher probability (greater than 35%) of being “drier than normal”, than “normal”, or “wetter than normal”.
  • WHITE indicates areas that have a higher probability of being “normal” than “drier or wetter than normal” and also, areas where the chances for being drier than normal, wetter than normal, and normal are equal.

It should be noted that areas in the “wetter than normal” region may still have drier than normal days, and may not be “flooded”. This outlook only suggests that after the three months are over, those areas in the “wetter than normal” region are more likely to have experienced wetter than normal average rainfall.

High Resolution Global Seasonal Outlook Graphics for Science On a Sphere®

Background and References:
Starting in April 2017, the IRI probabilistic seasonal climate forecast product is based on a re-calibration of model output from the U.S. National Oceanographic and Atmospheric Administration (NOAA)’s North American Multi-Model Ensemble Project (NMME). This includes the  ensemble seasonal prediction systems of NOAA’s National Centers for Environmental Prediction, Environment and Climate Change Canada, NOAA/Geophysical Fluid Dynamics Laboratory, NASA, NCAR and COLA/University of Miami. The output from each NMME model is re-calibrated prior to multi-model ensembling to form reliable probability forecasts. The forecasts are now presented on a 1-degree latitude-longitude grid.
IRI Seasonal Forecasts, http://portal.iri.columbia.edu/portal/server.pt?open=512&objID=944&PageID=0&cached=true&mode=2&userID=2
Credits:
EarthNow Team
NOAA
Category: Global Seasonal Outlook

Comments Off on Seasonal Outlooks (June, July and August 2019)
comments 
Comments Off on Seasonal Outlooks (June, July and August 2019)

Winter 2018-2019 Climate Digest

The December 2018 to February 2019 average temperature across the global land and ocean surface was the fourth highest since records began in 1880. Averaged as a whole, the temperature for meteorological winter was 0.84°C (1.51°F) above the 20th century average.

The global ocean-only temperature was the second highest on record.

In spite of an extreme Arctic blast in late January, the United States had a warmer than normal winter during December through February, with southeast states much warmer than normal.

Meanwhile the winter precipitation total was more than 2 inches above average, making this past winter the wettest winter on record for the contiguous United States.

To better understand our wet winter, this climate digest includes a 3-month display of “total precipitable water” (TPW) measured by polar-orbiting satellites, revealing moisture plumes in our atmosphere. Several atmospheric rivers can be seen flowing onto the U.S. west coast. Not surprisingly, California experienced record rains and above normal snowpack in the mountains. The good news is that California has been declared drought-free for the first time since December 2011! The bad news involved flooding along California’s Russian River, which crested at its highest level since 1995.

Record rainfall also resulted in flooding along the Mississippi River and Tennessee Valley this past winter.

In addition, multiple snowfall records were set in northern states from Washington to Wisconsin. In Eau Claire Wisconsin, February 2019 set an all-time record for the snowiest of any month on record, surpassing the previous record by more than 21 inches!

While watching the TPW loop look for 2 tropical cyclones swirling on either side of the equator near Australia. They are Typhoon Wutip spinning counterclockwise in the Northern Hemisphere and Tropical Storm Oma spinning clockwise in the Southern Hemisphere, opposite rotations due to the Coriolis effect.

The quarterly climate digest, produced seasonally, consists of a short movie (4:21 minutes) made for Science On a Sphere® (SOS) and an MP4 video accessible through YouTube.

You can download the SOS content from this FTP Site.

Content includes:
– Global 3-month averaged temperatures
– 3-month Sea Surface Temperature (SST) anomalies (showing El Niño conditions)
– 3-month Total Precipatable Water (TPW) imagery

References:

https://www.ncdc.noaa.gov/sotc/global/201903
https://www.ncdc.noaa.gov/sotc/national/201903
tropic.ssec.wisc.edu/real-time/mtpw2/

Credits:
EarthNow Team
National Oceanic and Atmospheric Administration(NOAA)

Monthly state of the climate reports are available from NOAA National Centers for Environmental Information (NCEI) Climate Global Analysis and National Overview at https://www.ncdc.noaa.gov/sotc/


Category: Uncategorized

Comments Off on Winter 2018-2019 Climate Digest
comments 
Comments Off on Winter 2018-2019 Climate Digest