October Climate Digest

Each month, around the middle of the month, we will provide information regarding the previous month’s climate, as well as the U.S. seasonal outlook for the coming months. Overall, preliminary data analysis suggests that October was the 8th warmest on record. Major stories include La Niña’s return, several areas with major flooding, and low concentrations of Arctic sea ice. More detailed information follows:
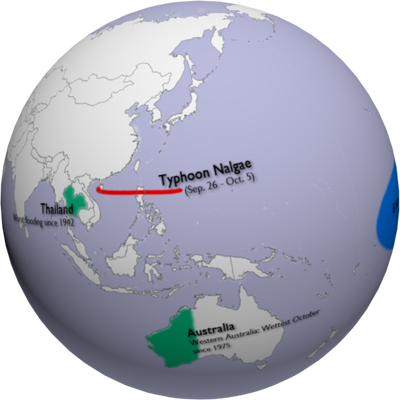
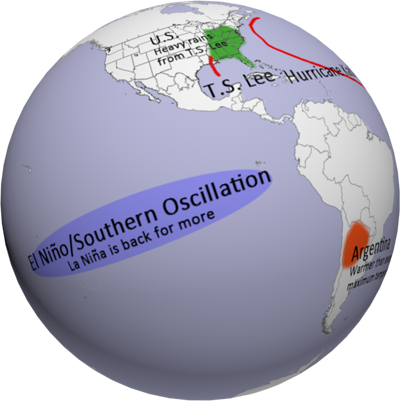
October Events GraphicOctober 2011 Major Events

  • This dataset highlights some of the major October events from the National Climatic Data Center’s (NCDC) monthly global climate analysis. The events are noted below with more information.
  • El Niño/Southern Oscillation: Cooler than average waters in the eastern central Pacific Ocean mean that La Niña has returned. Click here for more information about La Niña and how it may impact the outlook for the forthcoming Winter season.
  • United States: An early season storm brought heavy snow accumulations to parts of the northeast at the end of the month. (Oct. 29 – 31)
  • Central America: Two storm systems triggered major flooding in landslides across Central America. Nearly 60 inches (1,520 mm) of rain fell over a 10 day period. (Oct. 11 – 20)
  • Argentina: Several locations in eastern Argentina experienced their coolest October in five decades.
  • United Kingdom: The U.K. experienced its warmest October since 2006 and eighth warmest in the last 100 years.
  • Spain: Spain had its driest October since 1998.
  • Algeria: Hundreds of homes were destroyed and ten people were killed after northern Algeria experienced several days of heavy rainfall and flooding.
  • Thailand: Thailand experienced its worst flooding since 1942, due to storms and monsoon. (July-October 2011)
  • Australia: Western Australia recorded its wettest October since 1975 and third wettest since records began (1900).
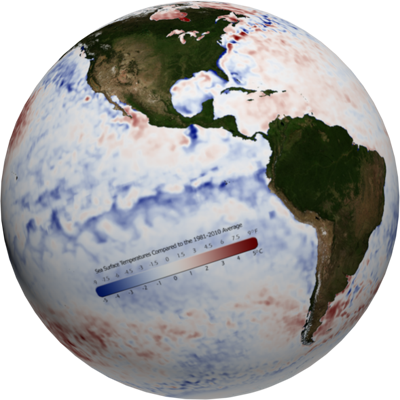
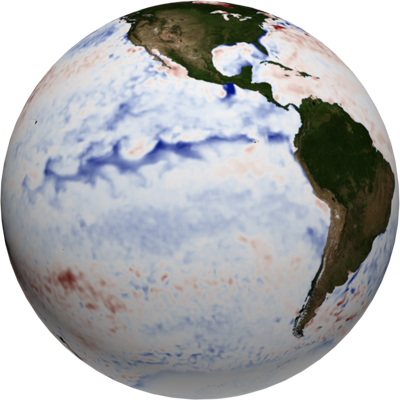
SST Anomaly GraphicSea Surface Temperature Anomaly

  • The real-time sea surface temperature anomaly dataset is a great way to visualize the cooler than normal waters in the eastern Pacific ocean. This indicates the La Niña pattern mentioned above.
  • Remember that the blues indicate cooler than average temperatures and reds indicate warmer than average temperatures (white: average).
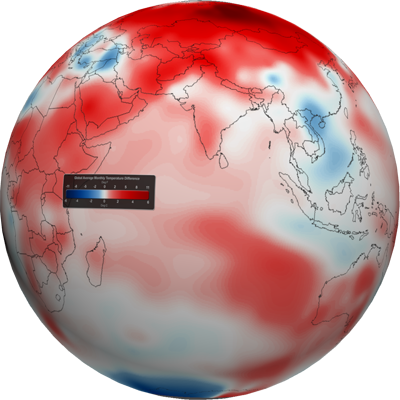
 

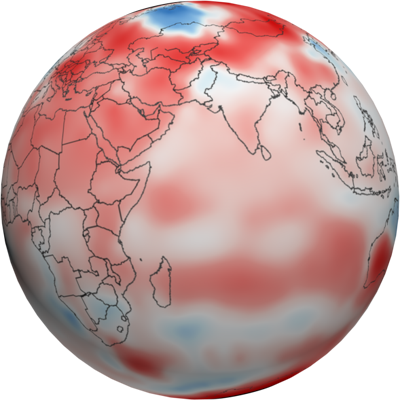
Global Temperature Anomalies GraphicGlobal Temperature Anomalies

  • Using the real-time Monthly Temperature Anomalies dataset is a great way to convey where some of the warmer and cooler than average areas were in October.
  • The combined global land and ocean average surface temperature for October 2011 was the eighth warmest on record at 14.58°C (58.14°F), which is 0.58°C (1.04°F) above the 20th century average.
  • The combined global land and ocean average surface temperature for the January – October period was 0.53°C (0.95°F) above the 20th century average, making it the 10th warmest such period on record.
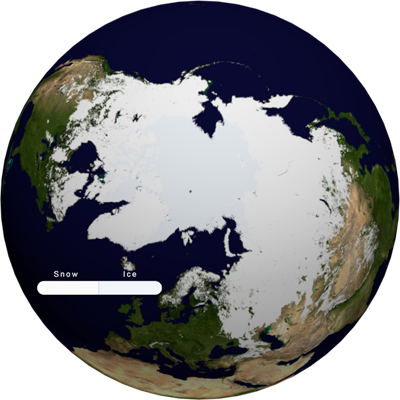
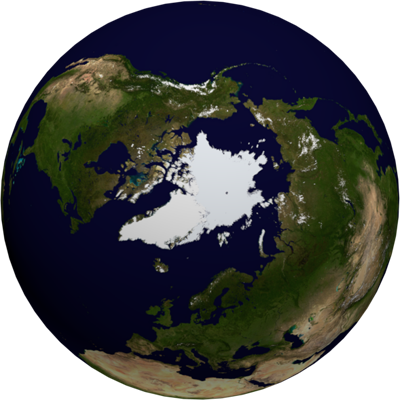
Snow and Ice GraphicSnow and Ice… Winter’s on its way!

  • Aside from helping to illustrate seasonal changes, the real-time Snow and Ice Cover dataset is a great way to convey sea ice change through time, including discussing how the current sea ice extent compares to other noteworthy years.
  • The Arctic sea ice extent in October was the second lowest on record, behind 2007. The extent was 23.5% below the 1979-2000 average.
  • In Antarctica (where it’s Summer), the October sea ice extent was the 12th largest on record, at 1.2% above the 1979-2000 average.
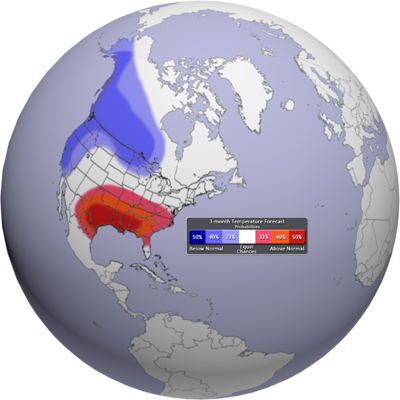
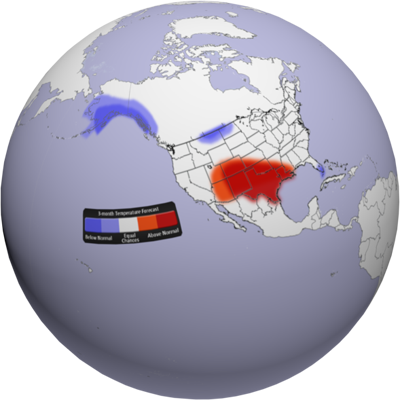
Temperature Outlook GraphicU.S. Climate Outlook – Temperature

  • As La Niña kicks into full swing for this winter, the effects will be felt across the country. For the December – February period, warmer than normal temperatures are expected across the southern plains and and into the southeast.
  • By contrast, cooler than normal temperatures can be expected for Alaska, the Pacific Northwest and California, as well as a region stretching from Montana to northern Wisconsin.
  • All other locations (in white) have equal chances of being warmer or cooler than normal. Major circulations and cycles (like La Niña) don’t play as much a role, making it more difficult to forecast.
  • Forecast by NOAA’s Climate Prediction Center (CPC)
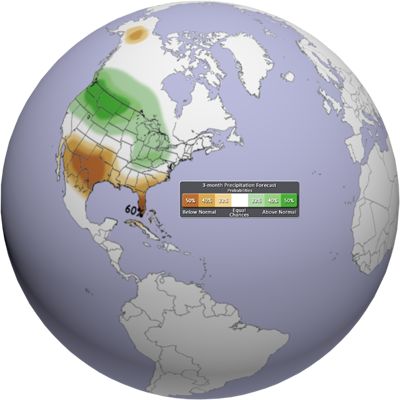
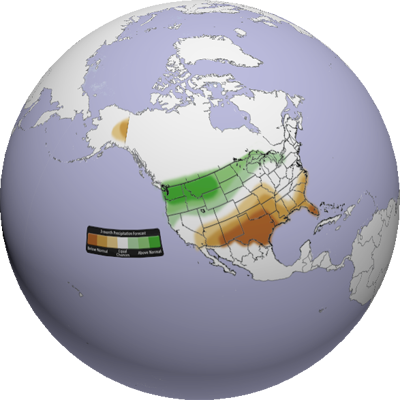
Precipitation Outlook GraphicU.S. Climate Outlook – Precipitation

  • For the next three months (Dec.-Feb.), drier than normal conditions will still prevail across the southern part of the country, especially Texas.
  • It is likely that southern Florida will experience drier than normal conditions.
  • Wetter than normal conditions, however, are expected across the northern states, especially in the northwest.
  • All other locations (in white) have equal chances of being wetter or drier than normal. Major circulations and cycles (like La Niña) don’t play as much a role, making it more difficult to forecast.
  • Forecast by NOAA’s Climate Prediction Center (CPC)

Helpful Resources for More Information

Where do I find the datasets?

  • First, check your SOS system to make sure it’s not already in an EarthNow playlist. As this is a very new project, we are experimenting with how to provide the visualizations. It might already be there.
  • If not, you can download the datasets and playlist.sos files from this FTP Site.

Well, that’s all for this time. Look forward to a look back at the 2011 Atlantic Hurricane season next time!

References:
NOAA Climate Prediction Center, http://www.cpc.ncep.noaa.gov/
NOAA National Climatic Data Center, State of the Climate: Global Analysis for October 2011, published online November 2011, retrieved on November 17, 2011 from http://www.ncdc.noaa.gov/sotc/global/2011/10.
Category: Climate Digest
Tags: , , , , , , , , ,
0 Comments

September Climate Digest

Each month, we will provide information regarding the previous month’s climate (this post was originally to be done in October), as well as the climate outlook for the coming months. Overall, preliminary data analysis suggests that September was the 8th warmest on record. Major stories include La Niña’s return and the Arctic sea ice annual minimum being the second smallest on record. More detailed information follows:

September 2011 Events GraphicSeptember 2011 Major Events

  • This dataset highlights some of the major September events from the National Climatic Data Center’s (NCDC) monthly global climate analysis. The events are noted below with more information.
  • El Niño/Southern Oscillation: Cooler than average waters in the eastern Pacific Ocean mean that La Niña has returned. Click here for more information about La Niña and how it may impact the outlook for the forthcoming Winter season.
  • Tropical Storm Lee was the 12th named storm of the 2011 Atlantic hurricane season, bringing with it rainfall totals of over 10 inches and damaging winds in some parts of the eastern third of the U.S. (Dates: Sep. 1-5)
  • Argentina‘s northern and west-central regions experienced warmer-than-average maximum temperatures, resulting in the warmest average maximum September temperature in 50 years.
  • Hurricane Katia was the 11th named storm of the 2011 Atlantic hurricane season. After becoming extratropical, the storm impacted the United Kingdom with strong winds. (Dates: Aug. 29-Sep. 10)
  • The United Kingdom had its warmest September since 2006 and the sixth warmest in the last 100 years.
  • Spain experienced its driest September since 1988.
  • China‘s Sichuan, Henan, and Shaanxi provinces experienced over a week of heavy rains, leading to deadly floods.
  • Typhoon Talas brought heavy rain and winds to western Japan and is being reported as the deadliest cyclone to hit Japan since 2004. (Dates: Aug. 23-Sep. 5)
  • Australia‘s September 2011 minimum temperature was the coolest since 1985. Also of note, Australia’s daily temperature range was wider than normal.
En ESPAÑOL

En Español

Este conjunto de datos pone de relieve algunos de los principales acontecimientos de septiembre de (CNDC) el análisis mensual de la National Climatic Data Center del clima global. Los eventos se indican a continuación con más información.

  • El Niño / Oscilación del Sur: temperaturas más bajas del promedio en el Océano Pacífico oriental decir que La Niña ha vuelto, y cómo pueden afectar las perspectivas para la temporada de invierno próxima.
  • La tormenta tropical Lee fue nombrado el 12 de la tormenta de la temporada 2011 de huracanes del Atlántico, trayendo consigo los totales de lluvia de más de 10 pulgadas y vientos dañinos en algunas partes del tercio oriental de los EE.UU. (Fechas: Sep. 1-5)
  • Regiones del norte y centro-oeste de la Argentina ha experimentado más cálidas que el promedio de temperaturas máximas, lo que resulta en el más cálido de la temperatura media máxima de septiembre en 50 años.
  • Huracán Katia fue la tormenta del 11 de nombre de la temporada 2011 de huracanes del Atlántico. Después de convertirse en extratropical, la tormenta impactó el Reino Unido, con fuertes vientos. (Fechas:. Agosto 29-septiembre 10)
  • El Reino Unido tuvo su más cálido desde 2006 y septiembre los más cálidos en sexto lugar en los últimos 100 años.
  • España, la sequía desde septiembre desde 1988.
  • China de Sichuan, Henan y Shaanxi experimentado más de una semana de fuertes lluvias, dando lugar a inundaciones.
  • Tifón Talas trajo fuertes lluvias y vientos de oeste Japón y se presenta como el más mortífero ciclón que afectó a Japón desde 2004. (Fechas:. 23 agosto-5 septiembre)
  • Septiembre de 2011 Australia temperatura mínima fue el más frío desde 1985. También los (ºC) de amplitud térmica diaria, fue en Australia el más alto de lo normal.

La Niña GraphicSea Surface Temperature Anomaly

  • The real-time sea surface temperature anomaly dataset is a great way to visualize the cooler than normal waters in the eastern Pacific ocean.
  • Remember that the blues indicate cooler than average temperatures and reds indicate warmer than average temperatures (white: average), not simply cool or warm. 3 million degrees is hot. 2 million degrees is also hot, but well below average.

September 2011 Temperature Anomalies GraphicGlobal Temperature Anomalies

  • Using the real-time Monthly Temperature Anomalies dataset is a great way to convey where some of the warmer and cooler than average areas were in September.
  • The combined global land and ocean average surface temperature for September 2011 was the 8th warmest on record at 15.53ºC (59.95ºF), which is 0.53ºC (0.95ºF) above the 20th century average.
  • The combined global land and ocean average surface temperature for the January-September period was 0.51ºC (0.92ºF) above the 20th century average, making it the 11th warmest on record.

September 2011 Snow and Ice GraphicSnow and Ice… brrrr!

  • Aside from helping to illustrate seasonal changes, the real-time Snow and Ice Cover dataset is a great way to convey sea ice change through time, including the Arctic’s annual minimum, which just so happens to be in September!
  • This year, the Arctic’s sea ice reached its minimum on September 9th. It was the second lowest on record (behind 2007) at 34.5% below the 1979-2000 average.
  • The Antarctic sea ice extent in September was the 14th largest on record at 0.1% above the 1979-2000 average.

September 2011 Temperature Outlook GraphicU.S. Climate Outlook – Temperature

  • As La Niña kicks into full swing for this winter, the effects will be felt across the country. For the November-January period, warmer than normal temperatures are expected across the southern plains and into the four corners region of the southwest.
  • By contrast, cooler than normal temperatures can be expected for Alaska, parts of Montana and North Dakota, as well as for the snow birds in south Florida.
  • All other locations (in white) have equal chances of being warmer or cooler than normal. Major circulations and cycles (like La Niña) don’t play as much a role, making it more difficult to forecast.
  • Forecast by NOAA’s Climate Prediction Center (CPC)

September 2011 Precipitation OutlookU.S. Climate Outlook – Precipitation

  • For the next three months (Nov.-Jan.), drier than normal conditions will still prevail across the southern part of the country, especially Texas.
  • Wetter than normal conditions, however, are expected across the northern states, especially in the northwest.
  • All other locations (in white) have equal chances of being wetter or drier than normal. Major circulations and cycles (like La Niña) don’t play as much a role, making it more difficult to forecast.
  • Forecast by NOAA’s Climate Prediction Center (CPC)

Helpful Resources for More Information

Where do I find the datasets?

  • First, check your SOS system to make sure it’s not already in an EarthNow playlist. As this is a very new project, we are experimenting with how to provide the visualizations. It might already be there.
  • If not, you can download the datasets and playlist.sos files from this FTP Site.

Well, that’s all for this time… any timely topics you want covered for next time?

Category: Climate Digest
Tags: , , , , , , , , , , ,
2 Comments

Inaugural EarthNow Entry: Ozone Hole Maximum

While those of us in the Northern Hemisphere are settling into Autumn, increased sunshine is making a rebound in the Southern Hemisphere. This may sound pleasant, but the increased sunshine along with other factors is what leads to the “ozone hole” many of us have heard of over the Antarctic. During the cold dark winters, temperatures drop below -78ºC (-108 F), promoting the production of of chemically active chlorine and bromine. When sunlight is combined with the chlorine and bromine in the Antarctic Spring, there is a reaction that leads to the breakdown of ozone, resulting in the Antarctic ozone hole (holes are areas with ozone concentrations of less than 220 Dobson Units). Feel free to use the information and datasets below to enhance your SOS presentation.

Visualizing “Real-time Stratospheric Ozone“.

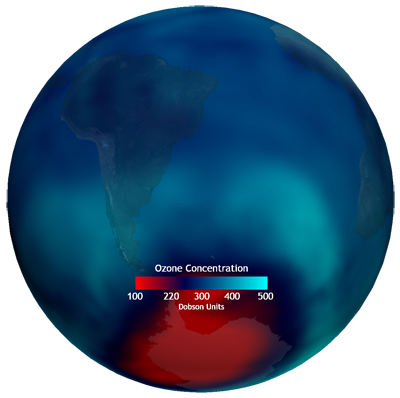
real-time Ozone dataset graphic

  • Overall, you will be able to use this dataset to show the changing ozone concentration, including the formation of the “ozone hole” starting in August.
  • The “ozone hole” is anything represented in red (below 220 Dobson Units).
  • Relatively low concentrations of ozone along the equator, as atmospheric circulations push ozone away from the equator towards the poles.
  • Note: If you would like to use this dataset, it should already be available on your SOS system via the RT (real-time) datasets.
Click for MORE INFORMATION

Stratospheric Ozone.

Ozone is a gas made of three oxygen atoms, and just like any other gas it circulates in the atmosphere. The stratospheric ozone layer is critical because it protects Earth from harmful ultraviolet solar radiation. Areas with ozone concentrations less than 220 Dobson Units are called “holes” in the layer. The Antarctic ozone hole is formed each year in the Southern Hemisphere spring (September-November) when there is a sharp decline (currently up to 60%) in the total ozone over most of Antarctica. During the cold dark Antarctic winter, stratospheric ice clouds form when temperatures drop below -78C. These very cold clouds are responsible for chemical changes that promote production of chemically active chlorine and bromine.  When sunlight is combines with the chlorine and bromine in the Antarctic Spring, there is a chemical reaction that changes ozone (O3) to regular oxygen (O2).  If this reaction occurs a lot, a hole forms.  Although some ozone depletion also occurs in the Arctic during the Northern Hemisphere spring (March-May), wintertime temperatures in the Arctic stratosphere are not persistently low for as many weeks which results in less ozone depletion. The production of ozone is high near the equator, but due to atmospheric circulation transporting the ozone to the poles, the equator tends to be a region of relatively low ozone through the year.

Scientific evidence, accumulated over more than two decades of study by the international research community, has shown that human-produced chemicals are responsible for the observed depletions of the ozone layer. The ozone-depleting compounds contain various combinations of the chemical elements chlorine, fluorine, bromine, carbon, and hydrogen and are often described by the general term halocarbons. Through an international agreement known as the Montreal Protocol on Substances that Deplete the Ozone Layer, governments have decided to eventually discontinue production of CFCs, halons, carbon tetrachloride, and methyl chloroform (except for a few special uses), and industry has developed more “ozone-friendly” substitutes. All other things being equal, and with adherence to the international agreements, the ozone layer is expected to recover over the next 50 years or so. NOAA’s polar orbiting satellites are used to monitor the ozone hole and the data taken from the POES satellites is processed and made available on a daily basis in near real-time.

Influence of the Changing Seasons on Ozone

At this point, I don’t have a corresponding visualization for this topic, but it should be noted. Why does the hole become larger during the spring, but not into the summer, if increased sun exposure is part of the cause of the growing ozone hole each year? Well, the increased sun energy is just a part of the reason.  The extremely cold temperatures coming out of winter is the other reason. Chlorine and Bromine, chemicals that are relatively stable under normal conditions, become chemically active due to extremely cold conditions. This is no longer the case as spring moves closer to summer, allowing the ozone to “fill” back in.

Click for MORE INFORMATION

Polar stratospheric clouds and ozone

Under normal atmospheric conditions, the two chemicals that store most atmospheric chlorine (hydrochloric acid, and chlorine nitrate) are stable. But in the long months of polar darkness over Antarctica in the winter, atmospheric conditions are unusual. An endlessly circling whirlpool of stratospheric winds called the polar vortex isolates the air in the center. Because it is completely dark, the air in the vortex gets so cold that clouds form, even though the Antarctic air is extremely thin and dry. Chemical reactions take place that could not take place anywhere else in the atmosphere. These unusual reactions can occur only on the surface of polar stratospheric cloud particles, which may be water, ice, or nitric acid, depending on the temperature.

These reactions convert the inactive chlorine reservoir chemicals into more active forms, especially chlorine gas (Cl2). When the sunlight returns to the South Pole in October, UV light rapidly breaks the bond between the two chlorine atoms, releasing free chlorine into the stratosphere, where it takes part in reactions that destroy ozone molecules while regenerating the chlorine (known as a catalytic reaction). A catalytic reaction allows a single chlorine atom to destroy thousands of ozone molecules. Bromine is involved in a second catalytic reaction with chlorine that contributes a large fraction of ozone loss. The ozone hole grows throughout the early spring until temperatures warm and the polar vortex weakens, ending the isolation of the air in the polar vortex. As air from the surrounding latitudes mixes into the polar region, the ozone-destroying forms of chlorine disperse. The ozone layer stabilizes until the following spring.

How this Year Stacks Up…

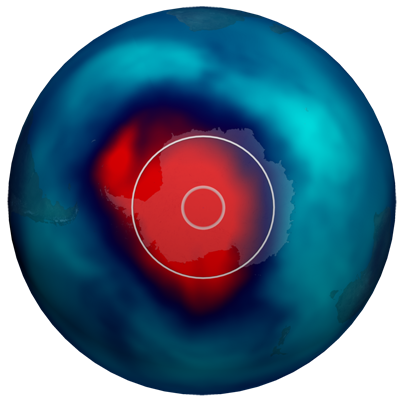
Ozone Hole Comparison Graphic

  • This dataset shows the October 10, 2011 data along with circles illustrating the areas of the ozone holes in 1981 (inner circle) and 1991 (outer circle).
  • 1981 maximum area: 1.3 Million Square Kilometers
  • 1991 maximum area: 21 Million Square Kilometers
  • 2011 maximum area: 25-26 Million Square Kilometers
  • For comparison: The United States is 9.36 Million Square Kilometers
  • It should be noted that all other things being equal, and with adherence to international agreements regarding CFCs, the ozone layer is expected to recover over the next 50 years or so. For more information about that, check out AMNH’s SOS production, “Ozone’s Slow Recovery.”
  • Note: If you wish to use this dataset as part of your presentation, you may need to download the files (see below) onto your system. We are trying to “push” the EarthNow playlist information to your systems, so please let me know if you DO “magically” have EarthNow playlists and datasets on your system.

Helpful Resources for more information:

Where do I get that really cool Ozone Comparison Dataset?

  • First, check your SOS system to make sure it’s not already in an EarthNow playlist. As this is a very new project, we are experimenting with how to provide the visualizations. It might already be there.
  • If not, you can download the dataset and playlist.sos file from this FTP Site.

Well, that wraps up the inaugural EarthNow blog entry. Please use the Contact link above to send me any feedback. Thank you!

Category: Atmosphere
Tags: , ,
0 Comments