Summer 2017 Climate Digest


Overview

The seasonal global land and ocean temperature for June–August 2017 was the third highest since global records began in 1880. The average temperature across the land surfaces was 2 degrees Fahrenheit above the 20th century average, the second highest June–August period in the 138-year record, slightly cooler than summer 2016.

The ocean surface temperature tied with 2015 as the second warmest summer season on record.

The United States had it’s fifteenth (15th) warmest and sixteenth (16th)  wettest summer in 2017.

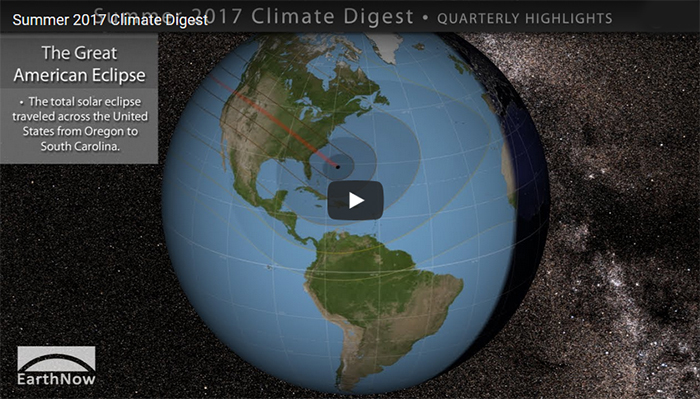
Two very significant phenomena took place this past summer, first the “Great American Eclipse” which occurred on August 21st when the moon passed directly between the sun and Earth causing a total solar eclipse. Satellites saw the moon’s shadow glide across the United States from Oregon to South Carolina!

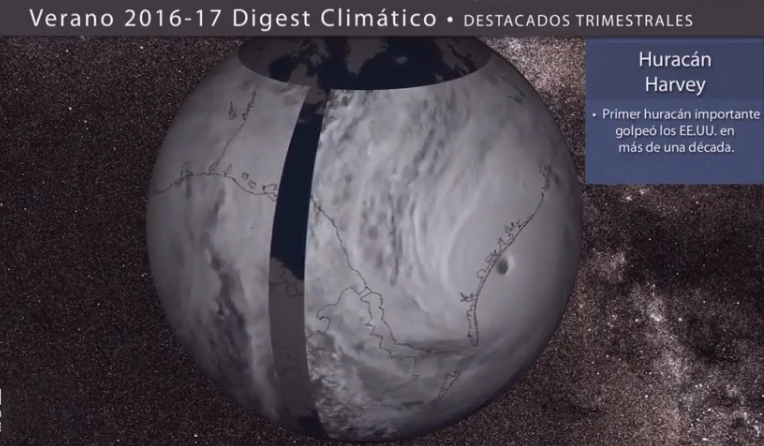
A week later tragedy struck when Hurricane Harvey made landfall in Texas. The slow moving storm dropped torrential rains across northeast Texas and southwest Louisiana. Record rainfall led to unprecedented flooding in Houston and surrounding areas. Tens of thousands of people were displaced due to floodwaters with thousands of homes and businesses destroyed. At least 70 fatalities were blamed on Hurricane Harvey

The quarterly climate digest, produced seasonally, consists of a short movie (3:24 minutes) made for SOS and an MP4 video accessible through YouTube.

NEW! A Spanish language version is also available on YouTube!
You can download the SOS content (both versions) from this FTP Site.

Content includes:

      • Global 3-month land temperatures
      • 3-month Sea Surface Temperature (SST) anomalies
      • GOES-16 animation of the August 21 total solar eclipse
      • GOES-16 animation of Hurricane Harvey making landfall (preliminary-non-operational data)

References:

      • https://www.ncdc.noaa.gov/sotc/global/201708
      • https://www.ncdc.noaa.gov/sotc/national/201706
      • https://www.ncdc.noaa.gov/sotc/national/201707
      • https://www.ncdc.noaa.gov/sotc/national/201708
      • https://www.theatlantic.com/technology/archive/2017/09/hurricane-harvey-deformed-the-earths-crust-around-houston/538866/
      • http://wapo.st/2x9O7j5
Credits:
EarthNow Team
National Oceanic and Atmospheric Administration (NOAA)

Monthly state of the climate reports are available from NOAA National Centers for Environmental Information (NCEI) Climate Global Analysis and National Overview at https://www.ncdc.noaa.gov/sotc/

 

Category: Climate, Climate Digest

Comments Off on Summer 2017 Climate Digest
comments 
Comments Off on Summer 2017 Climate Digest

Spring 2017 Climate Digest


Overview

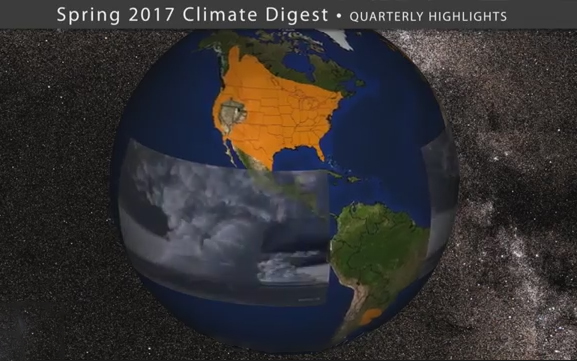
Globally, the average land and ocean surface temperature for March through May 2017 was the second highest since global temperature records began in 1880, coming in at 1.66°F (0.92°C) above the 20th century average, second to 2016 by a mere 0.15°C (0.27°F).

The most notable hot temperatures occurred over Asia, where temperature departures were 5.4°F (+3.0°C) or higher!

The United States had its’ eighth (8th) warmest and eleventh (11th) wettest spring on record.

The March through May average sea surface temperature was also the second warmest ever recorded.

Spring marks the beginning of tornado season, and 2017 was no exception. More than a dozen tornadoes touched down across five different states on March 6th. Tornado outbreaks in early and late April across the central and southern U.S. resulted in at least 8 people losing their lives. And a record-breaking tornado touched down in Wisconsin on May 16th when an EF-3 tornado stayed on the ground for 83 miles – over 6 times the length of the island of Manhattan.

The quarterly climate digest, produced seasonally, consists of a short movie (2:54 minutes) made for SOS and an MP4 video accessible through YouTube.

You can download the SOS content from this FTP Site.

Content includes:

  • Global 3-month land temperatures
  • 3-month Sea Surface Temperature (SST) anomalies
  • Seasonal tornado highlights

References:

  • https://www.ncdc.noaa.gov/sotc/global/201705
  • https://www.ncdc.noaa.gov/sotc/national/201705
  • https://www.ncdc.noaa.gov/sotc/national/201704
  • https://www.ncdc.noaa.gov/sotc/national/201703
  • http://www.weather.gov/mpx/May_16th_Wisconsin_Tornado_Upgraded_to_EF3
Credits:
EarthNow Team
National Oceanic and Atmospheric Administration (NOAA)
Leigh Orf tornado simulation graphics

Monthly state of the climate reports are available from NOAA National Centers for Environmental Information (NCEI) Climate Global Analysis and National Overview at https://www.ncdc.noaa.gov/sotc/


Category: Uncategorized

Comments Off on Spring 2017 Climate Digest
comments 
Comments Off on Spring 2017 Climate Digest

Ten year dataset of Tropospheric Nitrogen Dioxide (NO2)

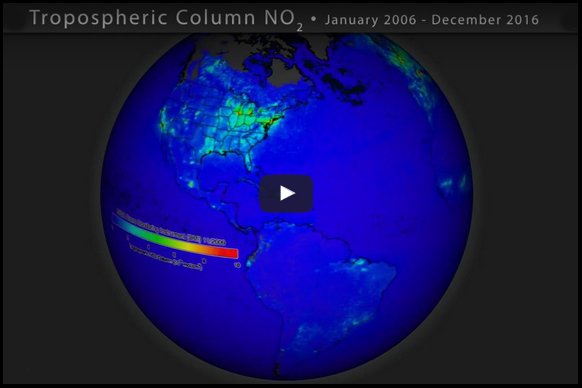
This dataset shows high-resolution (0.1×0.1 degree) monthly mean Tropospheric NO2 values acquired by Ozone Monitoring Instruments (OMI) on the NASA Aura satellite from 2006 to 2016. Nitrogen dioxide is a gaseous air pollutant produced by vehicle emissions and other fossil fuel combustion processes such as coal-fired electrical plants or biomass burning. Globally, the greatest NO2 emissions are from industrial areas and high-population urban centers. NASA measures and monitors NO2 because it contributes to the formation of other air pollutants, such as ozone.

You can download this 10-year dataset for SOS via this ftp link
(note – there is no audio)

You can also watch a preview on YouTube.

This 10-year animation compliments aerial data collected by the 2017 Lake Michigan Ozone Study (LMOS 2017) which commenced in May 2017 with flights along the shores of western Lake Michigan. The campaign provides extensive observational air quality and meteorology datasets through a combination of airborne, ship, mobile lab, and fixed ground-based observational platforms. The goal of the study is to better understand ozone formation and transport around Lake Michigan; in particular, why ozone concentrations are generally highest along the lakeshore and drop off sharply inland and why ozone concentrations sometimes peak in rural areas far from major emission sources.

LMOS 2017 measurements will provide critical observations for evaluating a new generation of air quality models attempting to better simulate ozone episodes in the region. Over the long term, the information collected is expected to result in:

  • Improved modeled ozone forecasts for this region, which states and EPA use to meet state and federal Clean Air Act
  • Better understanding of the lakeshore gradient in ozone concentrations
  • Improved knowledge of how emissions influence ozone formation in the region.

Learn more about the Lake Michigan Ozone Study from this NASA website.

Learn more about air quality in the Great Lakes Region from this video.

Category: Uncategorized

Comments Off on Ten year dataset of Tropospheric Nitrogen Dioxide (NO2)
comments 
Comments Off on Ten year dataset of Tropospheric Nitrogen Dioxide (NO2)