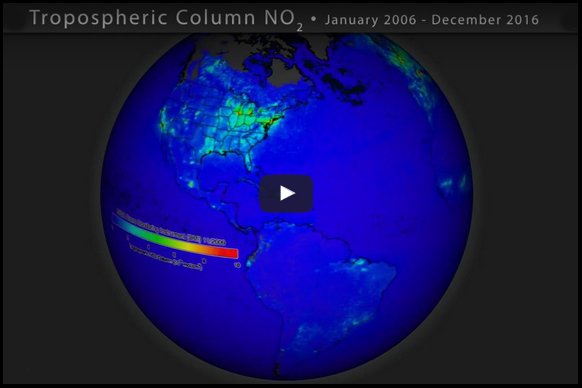
 This dataset shows high-resolution (0.1×0.1 degree) monthly mean Tropospheric NO2 values acquired by Ozone Monitoring Instruments (OMI) on the NASA Aura satellite from 2006 to 2016. Nitrogen dioxide is a gaseous air pollutant produced by vehicle emissions and other fossil fuel combustion processes such as coal-fired electrical plants or biomass burning. Globally, the greatest NO2 emissions are from industrial areas and high-population urban centers. NASA measures and monitors NO2 because it contributes to the formation of other air pollutants, such as ozone.
You can download this 10-year dataset for SOS via this ftp link
(note – there is no audio)
You can also watch a preview on YouTube.
This 10-year animation compliments aerial data collected by the 2017 Lake Michigan Ozone Study (LMOS 2017) which commenced in May 2017 with flights along the shores of western Lake Michigan. The campaign provides extensive observational air quality and meteorology datasets through a combination of airborne, ship, mobile lab, and fixed ground-based observational platforms. The goal of the study is to better understand ozone formation and transport around Lake Michigan; in particular, why ozone concentrations are generally highest along the lakeshore and drop off sharply inland and why ozone concentrations sometimes peak in rural areas far from major emission sources.
LMOS 2017 measurements will provide critical observations for evaluating a new generation of air quality models attempting to better simulate ozone episodes in the region. Over the long term, the information collected is expected to result in:
- Improved modeled ozone forecasts for this region, which states and EPA use to meet state and federal Clean Air Act
- Better understanding of the lakeshore gradient in ozone concentrations
- Improved knowledge of how emissions influence ozone formation in the region.
Learn more about the Lake Michigan Ozone Study from this NASA website.
Learn more about air quality in the Great Lakes Region from this video.


