
This animation reveals long-term trends in our oceans via a NOAA dataset depicting January sea surface temperature anomalies over the time period from 1921 through 2020. Anomalies are departures from average, in this case the average is from 1854 to 2016.
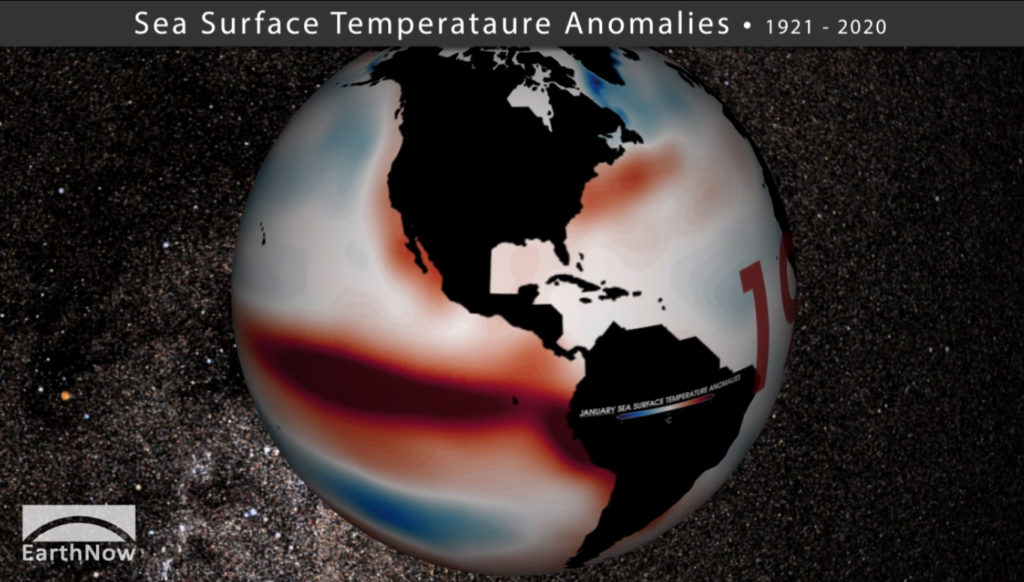
Along with considerable variability from year to year, a warming trend is noticeable over time. El Niño and La Niña episodes can also be discerned in the equatorial Pacific Ocean, especially the strong El Niño patterns from 1973, 1983 and 1988.
This 1-minute animation was produced for Science On a Sphere® (SOS) exhibits but is also accessible through YouTube.
You can download the SOS content from this FTP Site.
Content includes:
– Global January Sea Surface Temperature (SST) anomalies
References:


