Each month, around the middle of the month, we will provide information regarding the previous month’s climate, as well as the U.S. seasonal outlook for the coming months. Overall, preliminary data analysis suggests that November 2011 was the 11th warmest November on record. Major stories include La Niña, the Arctic Oscillation, and low concentrations of Arctic sea ice. More detailed information follows:
 November 2011 Event Highlights
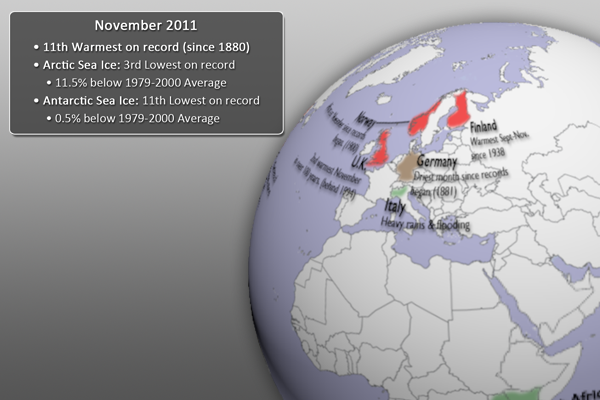
- This dataset highlights some of the major November events from the National Climatic Data Center’s (NCDC) monthly global climate analysis. The events are noted below with more information.
- El Niño/Southern Oscillation: Cooler than average waters in the eastern central Pacific Ocean mean that La Niña conditions continue. Click here for more information about La Niña and how it may impact the outlook for the forthcoming Winter season.
- Alaska: Fairbanks, Alaska set several new low minimum temperature records between November 15th-19th, the coldest of which was -41˚F (-41˚C).
- Bering Sea Superstorm: A very large extratropical cyclone impacted the Bering Sea Coast of Alaska, with high surf and hurricane-strength winds.
- United States: The northeastern U.S. experienced above average temperatures during November 2011, as well as the September-November 2011 period.
- Mexico: Nearly 70% of Mexico experienced the worst dry conditions in nearly 70 years.
- Colombia: Heavy rain and flooding on November 5th caused a deadly mudslide in the city of Manizales. About 250,000 people were affected.
- United Kingdom: The U.K. experienced its 2nd warmest November (behind 1994), as well as its 2nd warmest September-November period (behind 2006) in over 100 years.
- Germany: November 2011 was the driest month since national records began in 1881.
- Italy: Northwestern Italy had major flooding due to heavy rains.
- Norway: Warmest November (and September-November) since records began in 1900
- Finland: Warmest September-November period since 1938.
- Eastern Africa: Nearly 25,000 people were affected from several days (Nov. 9-15) of heavy rainfall in Uganda and Kenya.
- China: Experienced its wettest November since 1983.
- Australia: Western Australia experienced its wettest November since 1975 and second wettest November since records began in 1900.
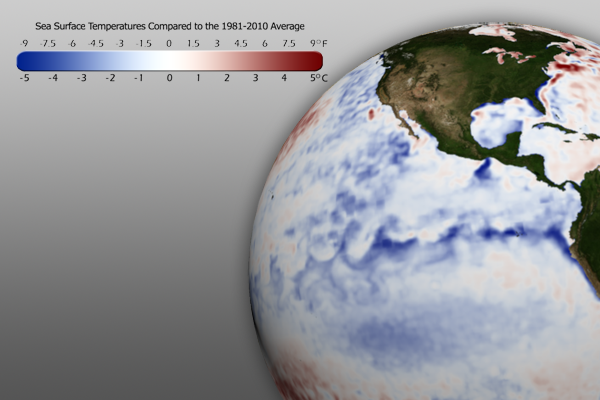 Sea Surface Temperature Anomaly
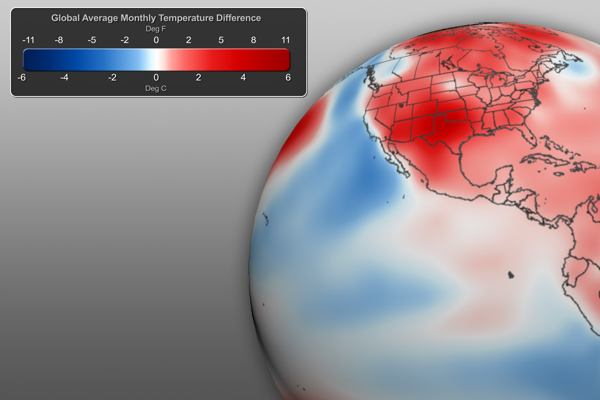
- The real-time sea surface temperature anomaly dataset is a great way to visualize the cooler than normal waters in the eastern central Pacific ocean. This indicates the La Niña pattern mentioned above.
- Remember that the blues indicate cooler than average temperatures and reds indicate warmer than average temperatures (white: average).
- Using the real-time Monthly Temperature Anomalies dataset is a great way to convey where some of the warmer and cooler than average areas were in November.
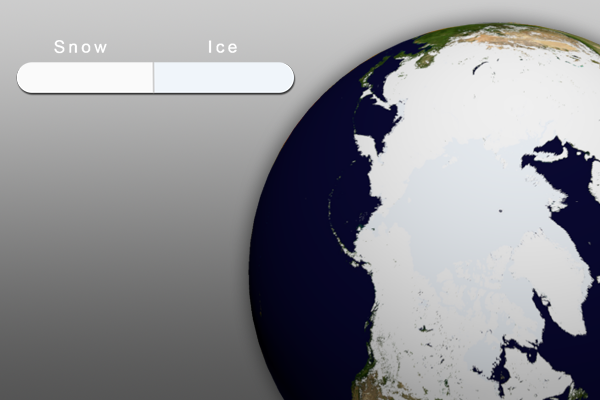
- Aside from helping to illustrate seasonal changes, the real-time Snow and Ice Cover dataset is a great way to convey sea ice change through time, including discussing how the current sea ice extent compares to other noteworthy years.
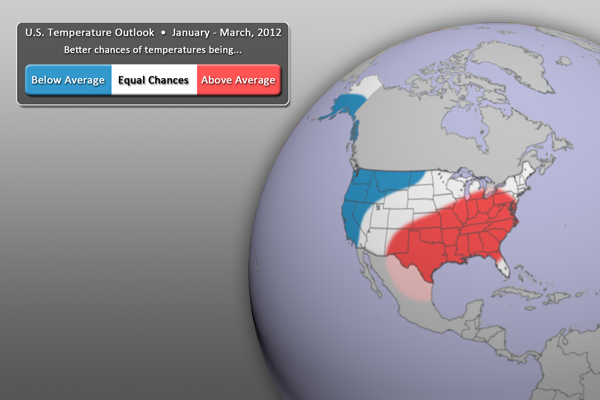 U.S. Climate Outlook – Temperature
- While La Niña will have some effect on the U.S. temperature outlook, other factors like the Arctic Oscillation may play a role as well (see below).
- For the January – March period, warmer than normal temperatures are expected across much of the eastern half of the country, especially the southeast.
- By contrast, cooler than normal temperatures can be expected for Alaska, the Pacific Northwest and California, as well as Montana.
- All other locations (in white) have equal chances of being warmer or cooler than normal.
- Outlook by NOAA’s Climate Prediction Center (CPC)
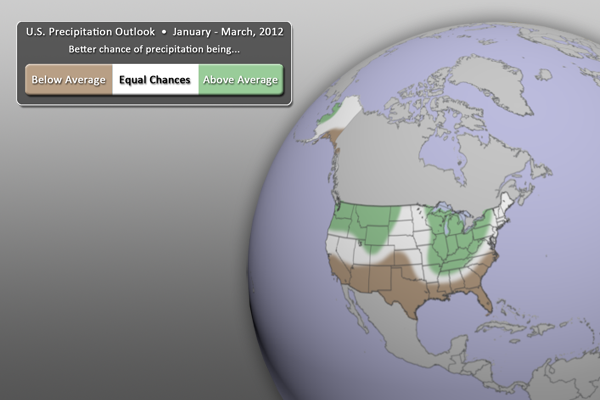 U.S. Climate Outlook – Precipitation
- For the next three months (January – March), drier than normal conditions will still prevail across the southern part of the country, especially Texas.
- Wetter than normal conditions, however, are expected across the Northwestern states, as well as the Great Lakes and Ohio River Valley States.
- All other locations (in white) have equal chances of being wetter or drier than normal. Major circulations and cycles (like La Niña) don’t play as much a role in some of these locations, making it more difficult to forecast.
- Outlook by NOAA’s Climate Prediction Center (CPC)
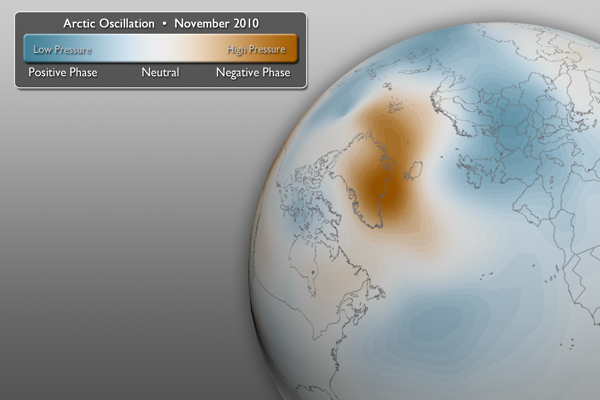
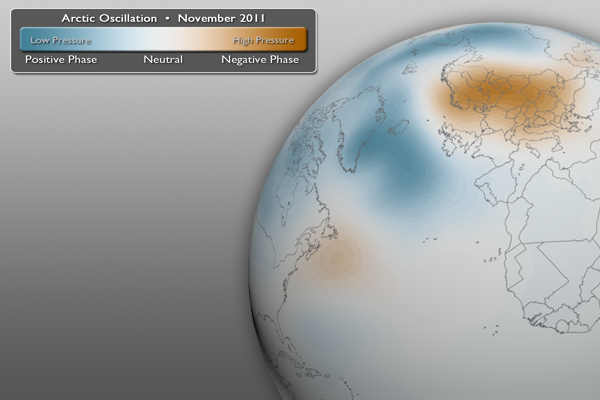 Arctic Oscillation… It’s called “oscillation” for a reason
- These two datasets show average pressure for November 2010 and November 2011.
- We’re focusing on the Arctic, more specifically the area around Greenland.
- Lower than normal pressure indicates a Positive Phase of the Arctic Oscillation.
- Higher than normal pressure indicates a Negative Phase of the Arctic Oscillation.
- As you can see, November 2010 and November 2011 are very different.
- While a La Niña would normally cause wetter and colder conditions for much of the northern U.S., it’s possible that the switch to the positive phase this year is responsible for the unseasonably warm and dry conditions so far this winter for the eastern two-thirds of the United States. Madison, Wisconsin, for example has an average of 13 inches of snow in December. So far, there has been no measurable snow!
- More information from the NOAA Environmental Visualization Lab: Blasts of cold Arctic air during the 2010 winter froze many parts of Northern Europe, Canada, and the U.S. One of the drivers of those frigid temperatures was very high pressure situated over the Arctic near Greenland. In 2010, the Arctic was in what is called a “negative phase” of the Arctic Oscillation – a climate cycle that affects seasonal weather patterns. This year, conditions have reversed, and the Arctic is now in a “positive phase,” whereby lower pressure sits over that same region. The differences between the surface pressure during November 2010 (left) and 2011 (right) can be seen in this image. Blue indicates areas where the geopotential height (pressure) at 1000 meters (a proxy for mean sea level pressure) is lower than normal, whereas orange indicates areas with a higher than normal value.
Helpful Resources for More Information
- http://nsidc.org/arcticmet/patterns/arctic_oscillation.html About Arctic Oscillation
- http://www.ncdc.noaa.gov/teleconnections/enso/enso-tech.php About ENSO (El Niño/La Niña)
- http://www.ncdc.noaa.gov/oa/ncdc.html National Climatic Data Center (NCDC)
- http://www.ncdc.noaa.gov/sotc/global/ NCDC’s Global Climate Report
- http://www.pmel.noaa.gov/tao/elnino/la-nina-story.html About La Niña
- http://www.cpc.ncep.noaa.gov/ Climate Prediction Center (CPC)
Where do I find the datasets?
- First, check your SOS system to make sure it’s not already in the EarthNow category. There should also be an ‘earthnow.sos’ playlist file (you’ll need to add that to your sosrc folder).
- If not, you can download the datasets and playlist.sos files from this FTP Site.

