2020 Climate Digest

Three phenomena dominated the Climate of 2020: wildfires, hurricanes, and the COVID-19 pandemic.

When Earth rotated into 2020, bush fires were raging in Australia. Smoke rose into the stratosphere and circled the globe for months. Later in the year, the western U.S. also experienced a devastating wildfire season, spewing even more smoke into Earth’s atmosphere.

Meanwhile travel restrictions due to the COVID-19 pandemic resulted in global reductions in air pollutants, especially atmospheric nitrogen. Lower fossil fuel use also resulted in a 7% reduction in atmospheric carbon dioxide.

Less air pollution allowed a little more shortwave solar energy to reach Earth’s surface. But wildfire smoke meant solar energy was reflected back to space. And lower levels of carbon dioxide allowed more longwave infrared energy, or heat, to escape out into space. All of these affected global temperatures.

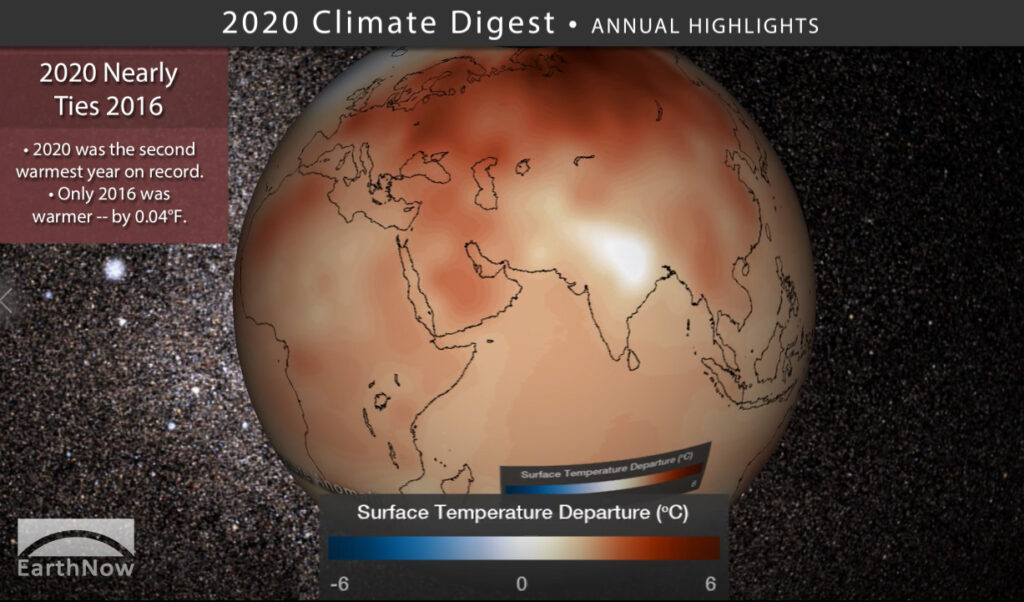
The global average land and ocean surface temperature in 2020 was 1.76 degrees Fahrenheit above average — only 4 tenths of 1 degree cooler than 2016. If not for extensive sunlight-reflecting wildfire smoke and lower levels of heat-trapping CO2 emissions due to the pandemic, 2020 may have surpassed 2016. As it was, Earth’s Northern Hemisphere saw its hottest year on record in 2020.

2020 also saw a record setting Atlantic hurricane season with 30 named storms, requiring the additional use of Greek letters to name them all. Seven systems caused over a billion dollars in damage! These were Hanna, Laura, Isaias, Sally, Delta, Eta and Zeta.

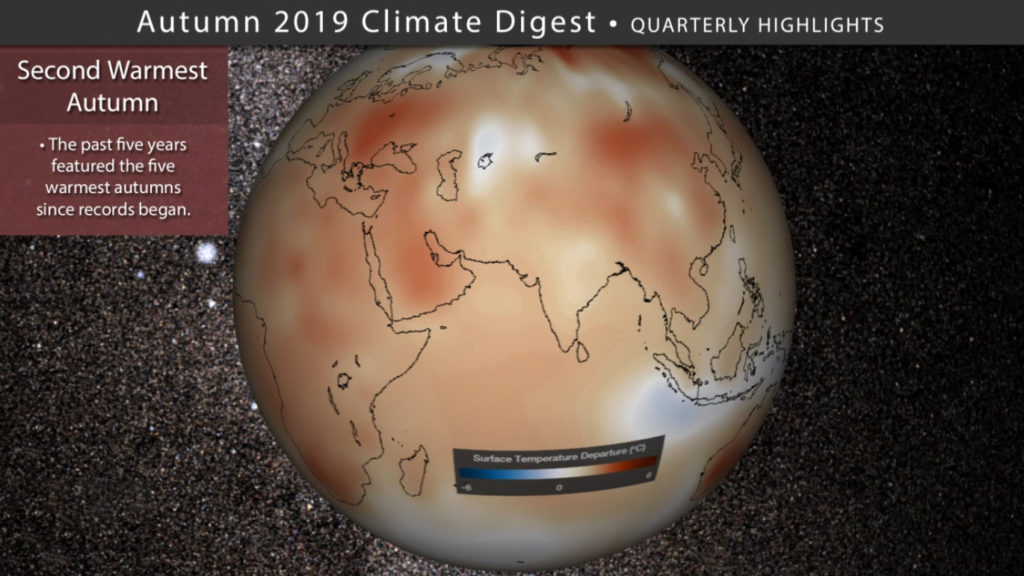
Research shows that the hurricane season is growing longer due to warmer ocean waters and warmer air temperatures. The ten hottest years have all occurred in the 21st century; the top two were 2016 and 2020.

The 2020 Climate Digest consists of a short movie (3:51 minutes) made for Science On a Sphere® (SOS) and an MP4 video accessible through YouTube.

Content includes:
– Smoke and aerosol patterns from the beginning of 2020
– Examples of decreases in NO2 for India and China
– NOAA-20 imagery of western U.S. wildfire smoke in September 2020
– Seven different 2020 hurricanes that caused over a billion dollars damage
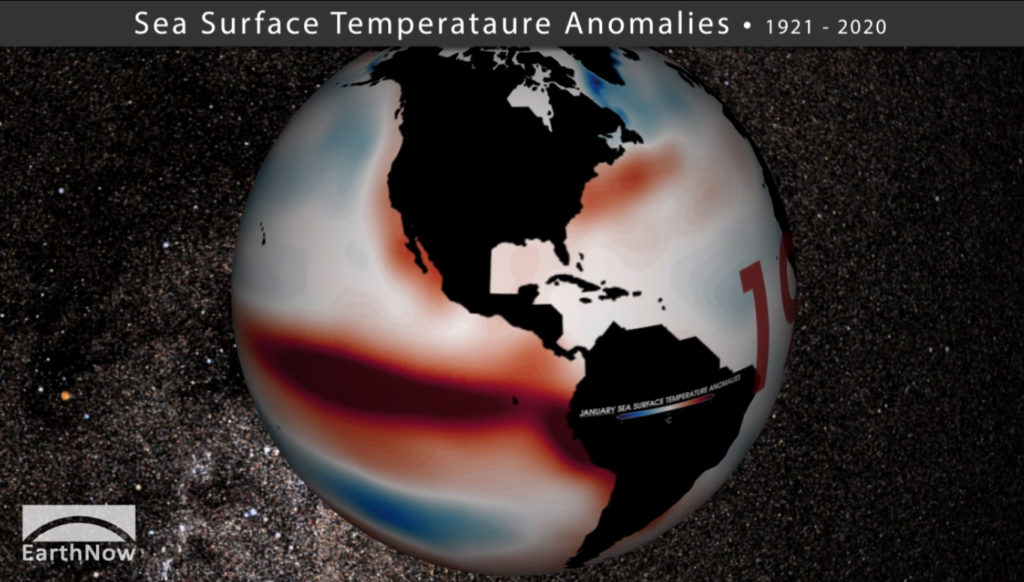
– 2020 Blended Land and Sea Surface Temperature Anomalies
– 100 years of Global Temperature Anomalies

You can download the SOS content from this FTP Site.

Credits: EarthNow Team

Music: Arctic Sea Ice by Judy Twedt

References:
2020 Global Climate Report https://www.ncdc.noaa.gov/sotc/global/202013
2020 Billion Dollar Disasters https://www.ncdc.noaa.gov/billions
2020 Carbon Budget https://globalocean.noaa.gov/News/2020-global-carbon-budget-released-1
NO2 Declines https://svs.gsfc.nasa.gov/4835
Australia Wildfire smoke and color bar https://gmao.gsfc.nasa.gov/research/science_snapshots/2020/Australia_fires_smoke.php

Category: Uncategorized

Comments Off on 2020 Climate Digest
comments 
Comments Off on 2020 Climate Digest

100 years of SST anomalies

This animation reveals long-term trends in our oceans via a NOAA dataset depicting January sea surface temperature anomalies over the time period from 1921 through 2020. Anomalies are departures from average, in this case the average is from 1854 to 2016.

Along with considerable variability from year to year, a warming trend is noticeable over time. El Niño and La Niña episodes can also be discerned in the equatorial Pacific Ocean, especially the strong El Niño patterns from 1973, 1983 and 1988.

This 1-minute animation was produced for Science On a Sphere® (SOS) exhibits but is also accessible through YouTube.

You can download the SOS content from this FTP Site.

Content includes:
– Global January Sea Surface Temperature (SST) anomalies

References:

https://www.ncdc.noaa.gov/data-access/marineocean-data/extended-reconstructed-sea-surface-temperature-ersst-v5

https://twitter.com/ZLabe/status/1225488374015942657

http://www.judytwedt.com/

Category: Uncategorized

Comments Off on 100 years of SST anomalies
comments 
Comments Off on 100 years of SST anomalies

Autumn 2019 Climate Digest

As a reminder, autumn in the Northern Hemisphere is spring in the Southern Hemisphere. But except for the notable cool temperatures over parts of North America, it was warmer than normal worldwide. In fact, global land and ocean surface temperatures for September-November 2019 was the second warmest in the 140-year record. The ten warmest September–November periods have occurred since 2005, and the five warmest autumns in the last five years. If you separate out land or ocean temperatures only, both categories rank 2nd warmest for 2019.

According to NOAA’s Climate Prediction Center, neutral El Niño-Southern Oscillation patterns are expected for the Northern Hemisphere winter. This means that neither El Niño nor La Niña should influence winter weather patterns.

The 2019 Atlantic Basin Hurricane Season ended on November 30th with 18 named storms, including two Category 5 hurricanes: Dorian and Lorenzo. Hurricane Dorian reached Category 5 strength on September 1st as it made landfall on the Bahamas. Dorian later brushed the coasts of Florida, Georgia, and South Carolina before making landfall as a Category 1 hurricane in the Outer Banks of North Carolina on September 6. From there, Dorian traveled north to impact Canada and Nova Scotia. In comparison, Hurricane Lorenzo unleashed most of its fury at sea as the easternmost Category 5 Atlantic hurricane on record. Lorenzo traveled from the coast of Africa northward over the Atlantic Ocean to eventually impact Ireland as an extratropical storm with gusty winds and heavy rains.

The quarterly climate digest, produced seasonally, consists of a short movie (3:09 minutes) made for Science On a Sphere® (SOS) and an MP4 video accessible through YouTube.

You can download the SOS content from this FTP Site.

Content includes:
– Global 3-month land and ocean temperatures
– 3-month Sea Surface Temperature (SST) anomalies
– Atlantic Basin 2019 Hurricane Season recap
– Satellite imagery of Hurricane Dorian U.S.
– Global temperature outlook for Winter

References:
https://www.ncdc.noaa.gov/sotc/global/201911
https://www.ncdc.noaa.gov/sotc/tropical-cyclones/201909
https://cimss.ssec.wisc.edu/goes/blog/archives/34315


Credits:
EarthNow Team
National Oceanic and Atmospheric Administration (NOAA)

State of the climate reports are available from NOAA National Centers for Environmental Information (NCEI) Climate Global Analysis and National Overview at https://www.ncdc.noaa.gov/sotc/
Category: Uncategorized

Comments Off on Autumn 2019 Climate Digest
comments 
Comments Off on Autumn 2019 Climate Digest