Winter? Winter? Winter? Anyone seen Winter?

As we begin February, the northern hemisphere winter has been unseasonably warm and less snowy for much of the United States and parts of Western Europe. Chicago, for example, had its warmest start to winter in about eighty years. While Punxsatawney Phil saw his shadow on Groundhog Day (2 February), indicating six more weeks of winter, NOAA’s Climate Prediction Center (CPC) suggests continued above normal temperatures for much of the U.S. over the next three months. For this EarthNow entry, we’ll take a look at snow and ice cover for January 2012 and how that compares with January 2011. Further, we’ll investigate how the North Atlantic Oscillation (NAO) may have a role in the not so winter-like conditions.

January 2012 Snow GraphicJanuary 2012, NAO: +

  •  This dataset shows the average snow and ice cover for January 2012.
  • After 10 seconds, High and Low Pressure icons will display on the SOS dataset. They will be relatively large icons, representing unusually strong low pressure over the North Atlantic (near Greenland and Iceland) and unusually strong high pressure over an area of the Atlantic several thousand miles south.
  • After another 10 seconds, a jet stream icon will display on the image. The unusually high and low pressure areas creates a very strong pressure gradient, which results in the jet stream to staying further north and zonal across the U.S. and Atlantic into Western Europe. Zonal simply means that the pattern is mostly straight across (from west to east) and isn’t very wavy.
  • This is the pattern that sets up during a positive (+) phase of the North Atlantic Oscillation (NAO).
  • Because the jet stream doesn’t dip very far south, the temperatures for the eastern part of the United States and western Europe tend to be above normal.
  • Further, storm systems (like snow storms) thrive on more wavy jet stream patterns, and so, with fewer storm systems and warmer than normal temperatures, these parts of the world experience unusually warm and less snowy winters.
  • The NAO has little impact on other parts of the world. Eastern Europe, for example has experienced a colder and snowier winter than normal.

January 2011 Snow Graphic
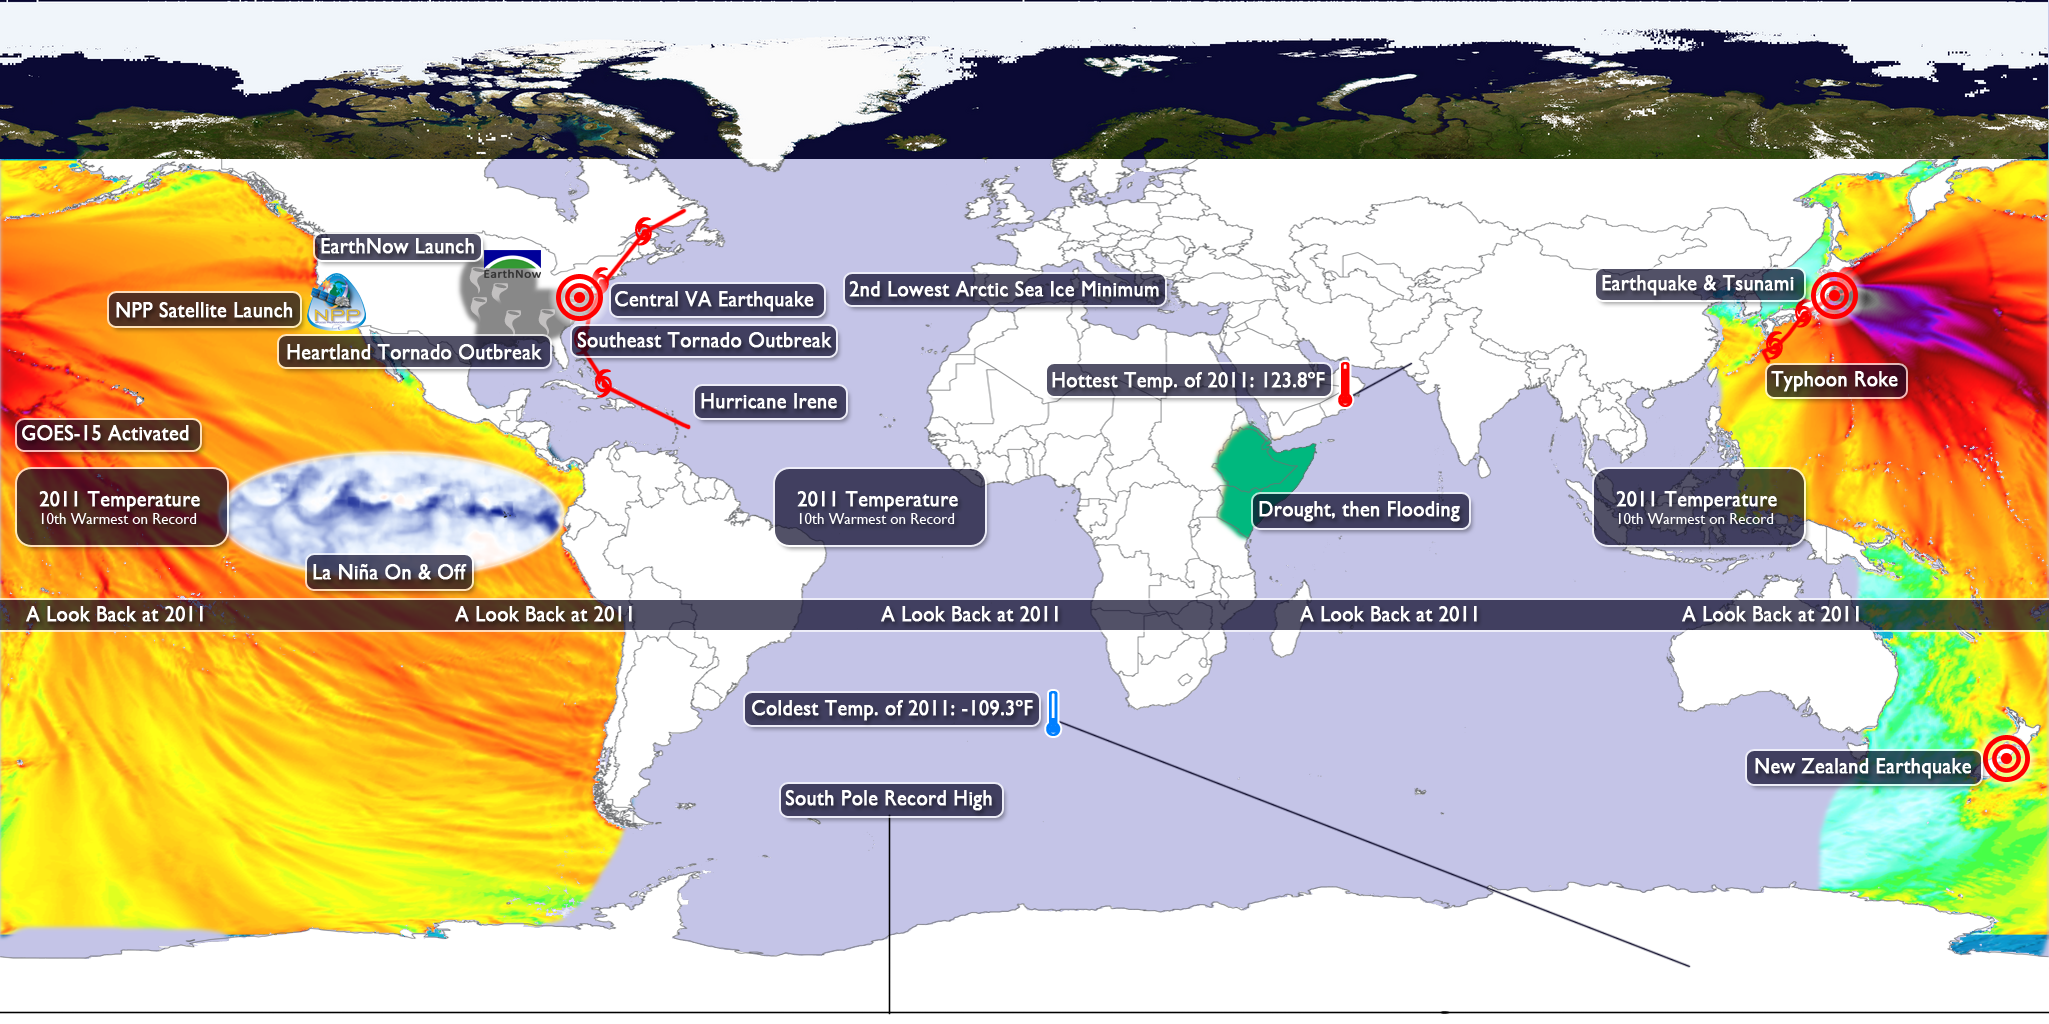
January 2011, NAO: –

  • This dataset shows the average snow and ice cover for January 2011. There is notably more snow across the U.S. and western Europe.
  • After 10 seconds, High and Low Pressure icons will display on the SOS dataset. They will be relatively small icons, representing an unusually weak low pressure over the North Atlantic (near Greenland and Iceland) and an unusually weak high pressure over an area of the Atlantic several thousand miles south.
  • After another 10 seconds, a jet stream icon will display on the image. The unusually weak high and low pressure areas means there isn’t much of a pressure gradient across the North Atlantic. This can occur when the jet stream is very wavy as it moves off the coast of the United States.
  • This is the pattern that sets up during a negative (-) phase of the North Atlantic Oscillation (NAO).
  • Because the jet stream dips farther to the south, the temperatures for the eastern part of the United States and western Europe tend to be below normal. Also, the more wavy jet stream patterns supports more slow-moving winter storms, resulting in more snowy conditions.

For a great explanation about the North Atlantic Oscillation by Penn State, click here!

NOAA also has a a nice explanation (albeit more technical) here.

The NAO is harder to predict than other more long-lasting cycles (like El Niño and La Niña), scientists use an array of models to help us predict what the NAO might do next. The latest models runs (at time of publication) suggest the NAO will remain in a positive phase (but perhaps drift closer to neutral).

That’s all for this week. The next post will be the January Climate Digest. Remember, to use the comments link below to discuss this topic with the EarthNow team, as well as the Science On a Sphere Network!

Where do I find the datasets?

  • First, check your SOS system to make sure it’s not already in the EarthNow category. There should also be an ‘earthnow.sos’ playlist file (you’ll need to add that to your sosrc folder).
  • If not, you can download the datasets and playlist.sos files from this FTP Site.
Credits:
Phil Arkini, Director, Cooperative Institute for Climate and Satellites (CICS)
Dan Pisut, NOAA Environmental Visualization Lab
Patrick Rowley, Cooperative Institute for Meteorological Satellite Studies (CIMSS)
References:
National Weather Service, Chicago,  http://www.crh.noaa.gov/news/display_cmsstory.php?wfo=lot&storyid=78507&source=0
NOAA Climate Prediction Center,http://www.cpc.ncep.noaa.gov/
NOAA Climate Prediction Center, NAO, http://www.cpc.ncep.noaa.gov/products/precip/CWlink/pna/nao.shtml
Penn State University, NAO, https://www.e-education.psu.edu/worldofweather/s15.html
Category: Earth Systems
Tags: , , , , ,
0 Comments

December 2011 Climate Digest

Each month, around the middle of the month, we will provide information regarding the previous month’s climate, as well as the U.S. seasonal outlook for the coming months. Overall, preliminary data analysis suggests that December 2011 was the 10th warmest December on record. Major stories include La Niña, several tropical cyclones, and low concentrations of Arctic sea ice. More detailed information follows:

December 2011 Events Graphic December 2011 Event Highlights

  • This dataset highlights some of the major December events from the National Climatic Data Center’s (NCDC) monthly global climate analysis. The events are noted below with more information.
  • El Niño/Southern Oscillation: Cooler than average waters in the eastern central Pacific Ocean mean that La Niña conditions continue. Click here for more information about La Niña and how it may impact the outlook for the forthcoming Winter season.
  • Alaska: December 2011 was the third warmest December on record (since 1918).
  • United States: Blizzard conditions impacted the southern Rocky Mountains and Central Plains (Dec. 19-20).
  • United Kingdom: The UK had its warmest December since 2006.
  • Spain: December 2011 was Spain’s driest since 1988.
  • South Pole: The South Pole recorded a new all-time high temperature of -12.3˚C (9.9˚F) on December 25th. The previous record was -13.6˚C (7.5˚F), set on December 27, 1978.
  • Tropical Cyclone Thane: Tropical Cyclone Thane brought heavy rain and strong winds to the southeast India region, killing 42 people. The maximum winds were 150 km/hr (93 mph). (Dec. 25-31)
  • Tropical Storm Washi: Tropical Storm Washi brought heavy rain to the southern Philippines, causing landslides and flooding. Nearly 1,300 people were killed. (Dec. 13-19)

Sea Surface Temperature Anomaly Graphic - December 2011Sea Surface Temperature Anomaly

  • The real-time sea surface temperature anomaly dataset is a great way to visualize the cooler than normal waters in the eastern central Pacific ocean. This indicates the La Niña pattern mentioned above.
  • Remember that the blues indicate cooler than average temperatures and reds indicate warmer than average temperatures (white: average).

Global Temperature Anomaly Graphic - December 2011Global Temperature Anomalies

  • Using the real-time Monthly Temperature Anomalies dataset is a great way to convey where some of the warmer and cooler than average areas were in November.
    • The combined global land and ocean average surface temperature for December 2011 was the tenth warmest on record at 12.2˚C (54.0˚F), which is 0.48˚C (0.86˚F) above the 20th century average.
    • The combined global land and ocean average surface temperature for the January – December period was 0.51˚C (0.92˚F) above the 20th century average, making it the 11th warmest such period on record.

Snow and Ice Graphic - December 2011Snow and Ice…

  • Aside from helping to illustrate seasonal changes, the real-time Snow and Ice Cover dataset is a great way to convey sea ice change through time, including discussing how the current sea ice extent compares to other noteworthy years.
  • The Arctic sea ice extent in December was the fourth lowest on record. The extent was 7.4% below the 1979-2000 average.
  • In Antarctica, the December sea ice extent was the 5th largest on record, at 9.8% below the 1979-2000 average.

U.S. Temperature Outlook - FMA 2012U.S. Climate Outlook – Temperature

  • Weak to moderate La Niña conditions are expected to influence the U.S. temperature outlook (see below).
  • For the February – April period, warmer than normal temperatures are expected across much of the southern half of the country, from the southwest plateau region eastward into the Mid Atlantic region.
  • By contrast, cooler than normal temperatures can be expected for the southern half of Alaska, the Pacific Northwest and California, as well as Montana.
  • All other locations (in white) have equal chances of being warmer or cooler than normal.
  • Outlook by NOAA’s Climate Prediction Center (CPC)
  • In its forecasts, the CPC uses a wide variety of models in conjunction with looking at climate variables (like La Niña).
  • It should be noted that areas be in the “warmer than normal” region may still have bitterly cold winter days. This outlook only suggests that after the three months (February, March, and April) are over, those areas in the “warmer than normal” region are more likely to have experienced warmer than normal average temperatures. The same is true for the “cooler than normal” and “equal chances” regions.

U.S. Precipitation Outlook FMA 2012U.S. Climate Outlook – Precipitation

  • For the next three months (February – April), drier than normal conditions are expected for much of the southern third of the country, as well as the southeast coastal states. The very southernmost parts of Alaska can also expect drier than normal conditions.
  • Wetter than normal conditions, however, are expected across the Northwestern states, as well as the Great Lakes and Ohio/Tennessee River Valley States.
  • All other locations (in white) have equal chances of being wetter or drier than normal.
  • Outlook by NOAA’s Climate Prediction Center (CPC)
  • In its forecasts, the CPC uses a wide variety of models in conjunction with looking at climate variables (like La Niña).
  • It should be noted that areas be in the “drier than normal” region may still have rain and snow storms. This outlook only suggests that after the three months (February, March, and April) are over, those areas in the “drier than normal” region are more likely to have experienced drier than normal averages. The same is true for the “wetter than normal” and “equal chances” regions.

Helpful Resources for More Information

Where do I find the datasets?

  • First, check your SOS system to make sure it’s not already in the EarthNow category. There should also be an ‘earthnow.sos’ playlist file (you’ll need to add that to your sosrc folder).
  • If not, you can download the datasets and playlist.sos files from this FTP Site.
Credits:
Derek Arndt, NOAA National Climatic Data Center
Gerry Bell, Lead Forecaster/Meteorologist, NOAA Climate Prediction Center
Jessica Blunden, NOAA National Climatic Data Center
Gregory Hammer, NOAA National Climatic Data Center
Ed Olenic, NOAA Climate Prediction Center
Kenneth Pelman, NOAA Climate Prediction Center
Dan Pisut, NOAA Environmental Visualization Lab
Matthew Rosencrans, NOAA Climate Prediction Center
Patrick Rowley, Cooperative Institute for Meteorological Satellite Studies
Eileen Shea, NOAA National Climatic Data Center
References:
NOAA Climate Prediction Center, http://www.cpc.ncep.noaa.gov/
NOAA National Climatic Data Center, State of the Climate: Global Analysis for December 2011, published online January 2012, retrieved on January 19, 2012 from http://www.ncdc.noaa.gov/sotc/global/2011/12
Category: Climate Digest
Tags: , , , ,
0 Comments

2011 – A Year of Extremes

Happy New Year, everyone!

For this EarthNow entry, we thought it would be nice to do a global Look Back at 2011, with regards to major weather and earth science events, as well as some important climate measurements. The bullet points below will simply tell you about how the dataset works. Below the bullet points, you will find more information regarding the events. For even more information, we have provided links for some of the events, as well. Enjoy!

2011 Review

2011 Review • Animation not work? Click HereStill Map Image

A 2011 Review

  • This dataset contains a sequence of 14 frames, or images. The first frame is the “Title Frame.” The next 12 frames contain 1 frame for each month of 2011, with the 14th frame being a conclusion frame, highlighting all of the events of 2011.
  • When you load the dataset, the animation will not start by default, allowing you to step through frame by frame using the remote. You can of course “Play” the animation, during which each frame will last for 20 seconds. These settings can be changed in the playlist setting for the file.

Monthly Highlights

January

  • La Niña: In place for most of the year, with a brief hiatus during May – August [more information]
  • Drought & Famine: Drought and related famine for much of the year in East Africa. [more information]

February

  • La Niña Continues
  • Drought & Famine Continue
  • New Zealand Earthquake: February 22nd, 6.1. magnitude, near Christchurch, New Zealand [more information]

March

  • La Niña Continues
  • Drought & Famine Continue
  • Japan Earthquake & Tsunami: March 11th, 9.0 magnitude [more information]

April

May

  • La Niña transitions into a Neutral phase
  • Drought & Famine Continue
  • Midwest Tornado Outbreaks: Throughout the month, 355 tornadoes, 158 fatalities, mostly in Joplin, Missouri [more information: part 1] [more information: part 2]
  • Coldest Temperature of 2011 Recorded: -109.3˚F (-78.5˚C), May 20th, Vostok Antarctic Research Station

June

  • Drought & Famine Continue
  • Hottest Temperature of 2011 Recorded: 123.8˚F (51.0˚C), June 8th, Nawabshah, Pakistan

July

  • Drought & Famine Continue

August

September

  • La Niña Continues
  • Drought & Famine Continue
  • Arctic Sea Ice Minimum: September 9th, 2nd lowest minimum on record
  • Typhoon Roke: September 9-21, East coast of Japan, along same areas affected by earthquake and tsunami, 13 fatalities [more information]

October

  • La Niña Continues
  • Flooding: Drought & Famine in East Africa give way to to heavy rain and flooding [more information]
  • EarthNow: Officially launched in October [more information]
  • NPP Satellite Launch: October 28th, Vandenberg Air Force Base, California, Providing enhanced Earth observations [more information]

November

  • La Niña Continues
  • Flooding in East Africa Continues

December

  • La Niña Continues
  • Flooding in East Africa wanes
  • South Pole Record High Recorded: December 25th, 9.9˚F (-12.3˚C), Old Record: 7.7˚F (-13.6˚C) [more information]
  • GOES-15 Activated: December 6th, Provides more data and higher resolution [more information]

Where do I find the datasets?

  • First, check your SOS system to make sure it’s not already in the EarthNow category. There should also be an ‘earthnow.sos’ playlist file (you’ll need to add that to your sosrc folder).
  • If not, you can download the datasets and playlist.sos files from this FTP Site.

That’s all for now. The next update will be the December Climate Digest.

Click for REFERENCES

References

AMRC/SSEC, South Pole’s Record Breaking Week, http://amrc.ssec.wisc.edu/blog/2011/12/31/south-poles-record-breaking-week/
CIMSS Satellite Blog, GOES-15 replaces GOES-11 as the operational GOES-West satellite, http://cimss.ssec.wisc.edu/goes/blog/archives/category/goes-15/page/2
NASA Earth Observatory, Image of the Day, http://earthobservatory.nasa.gov/IOTD/view.php?id=52224
NASA, NPOESS Preparatory Project, http://npp.gsfc.nasa.gov/
NOAA National Climatic Data Center, State of the Climate: Tornadoes for April 2011, published online May 2011, retrieved on January 7, 2012 from http://www.ncdc.noaa.gov/sotc/tornadoes/2011/4.
NOAA National Climatic Data Center, State of the Climate: Tornadoes for May 2011, published online June 2011, retrieved on January 7, 2012 from http://www.ncdc.noaa.gov/sotc/tornadoes/2011/5.
NOAA News, 2011 Tornado Information, http://www.noaanews.noaa.gov/2011_tornado_information.html
NOAA News, Active 2011 hurricane season breaks ‘Hurricane Amnesia’, http://www.noaanews.noaa.gov/stories2011/20111128_endofhurricaneseason_2011.html
USGS, 2011 February 21 23:51:42 UTC, New Zealand, http://earthquake.usgs.gov/earthquakes/eqinthenews/2011/usb0001igm/#details
USGS, 2011 March 11 05:46:24 UTC, Japan, http://earthquake.usgs.gov/earthquakes/eqinthenews/2011/usc0001xgp/
USGS, 2011 August 23 17:51:04 UTC, Virginia, http://earthquake.usgs.gov/earthquakes/eqinthenews/2011/se082311a/
WMO, Provisional Statement on the Status of the Global Climate, http://www.wmo.int/pages/mediacentre/press_releases/gcs_2011_en.html

Category: Annual Review
Tags: , , , , , , , , , ,
1 Comment